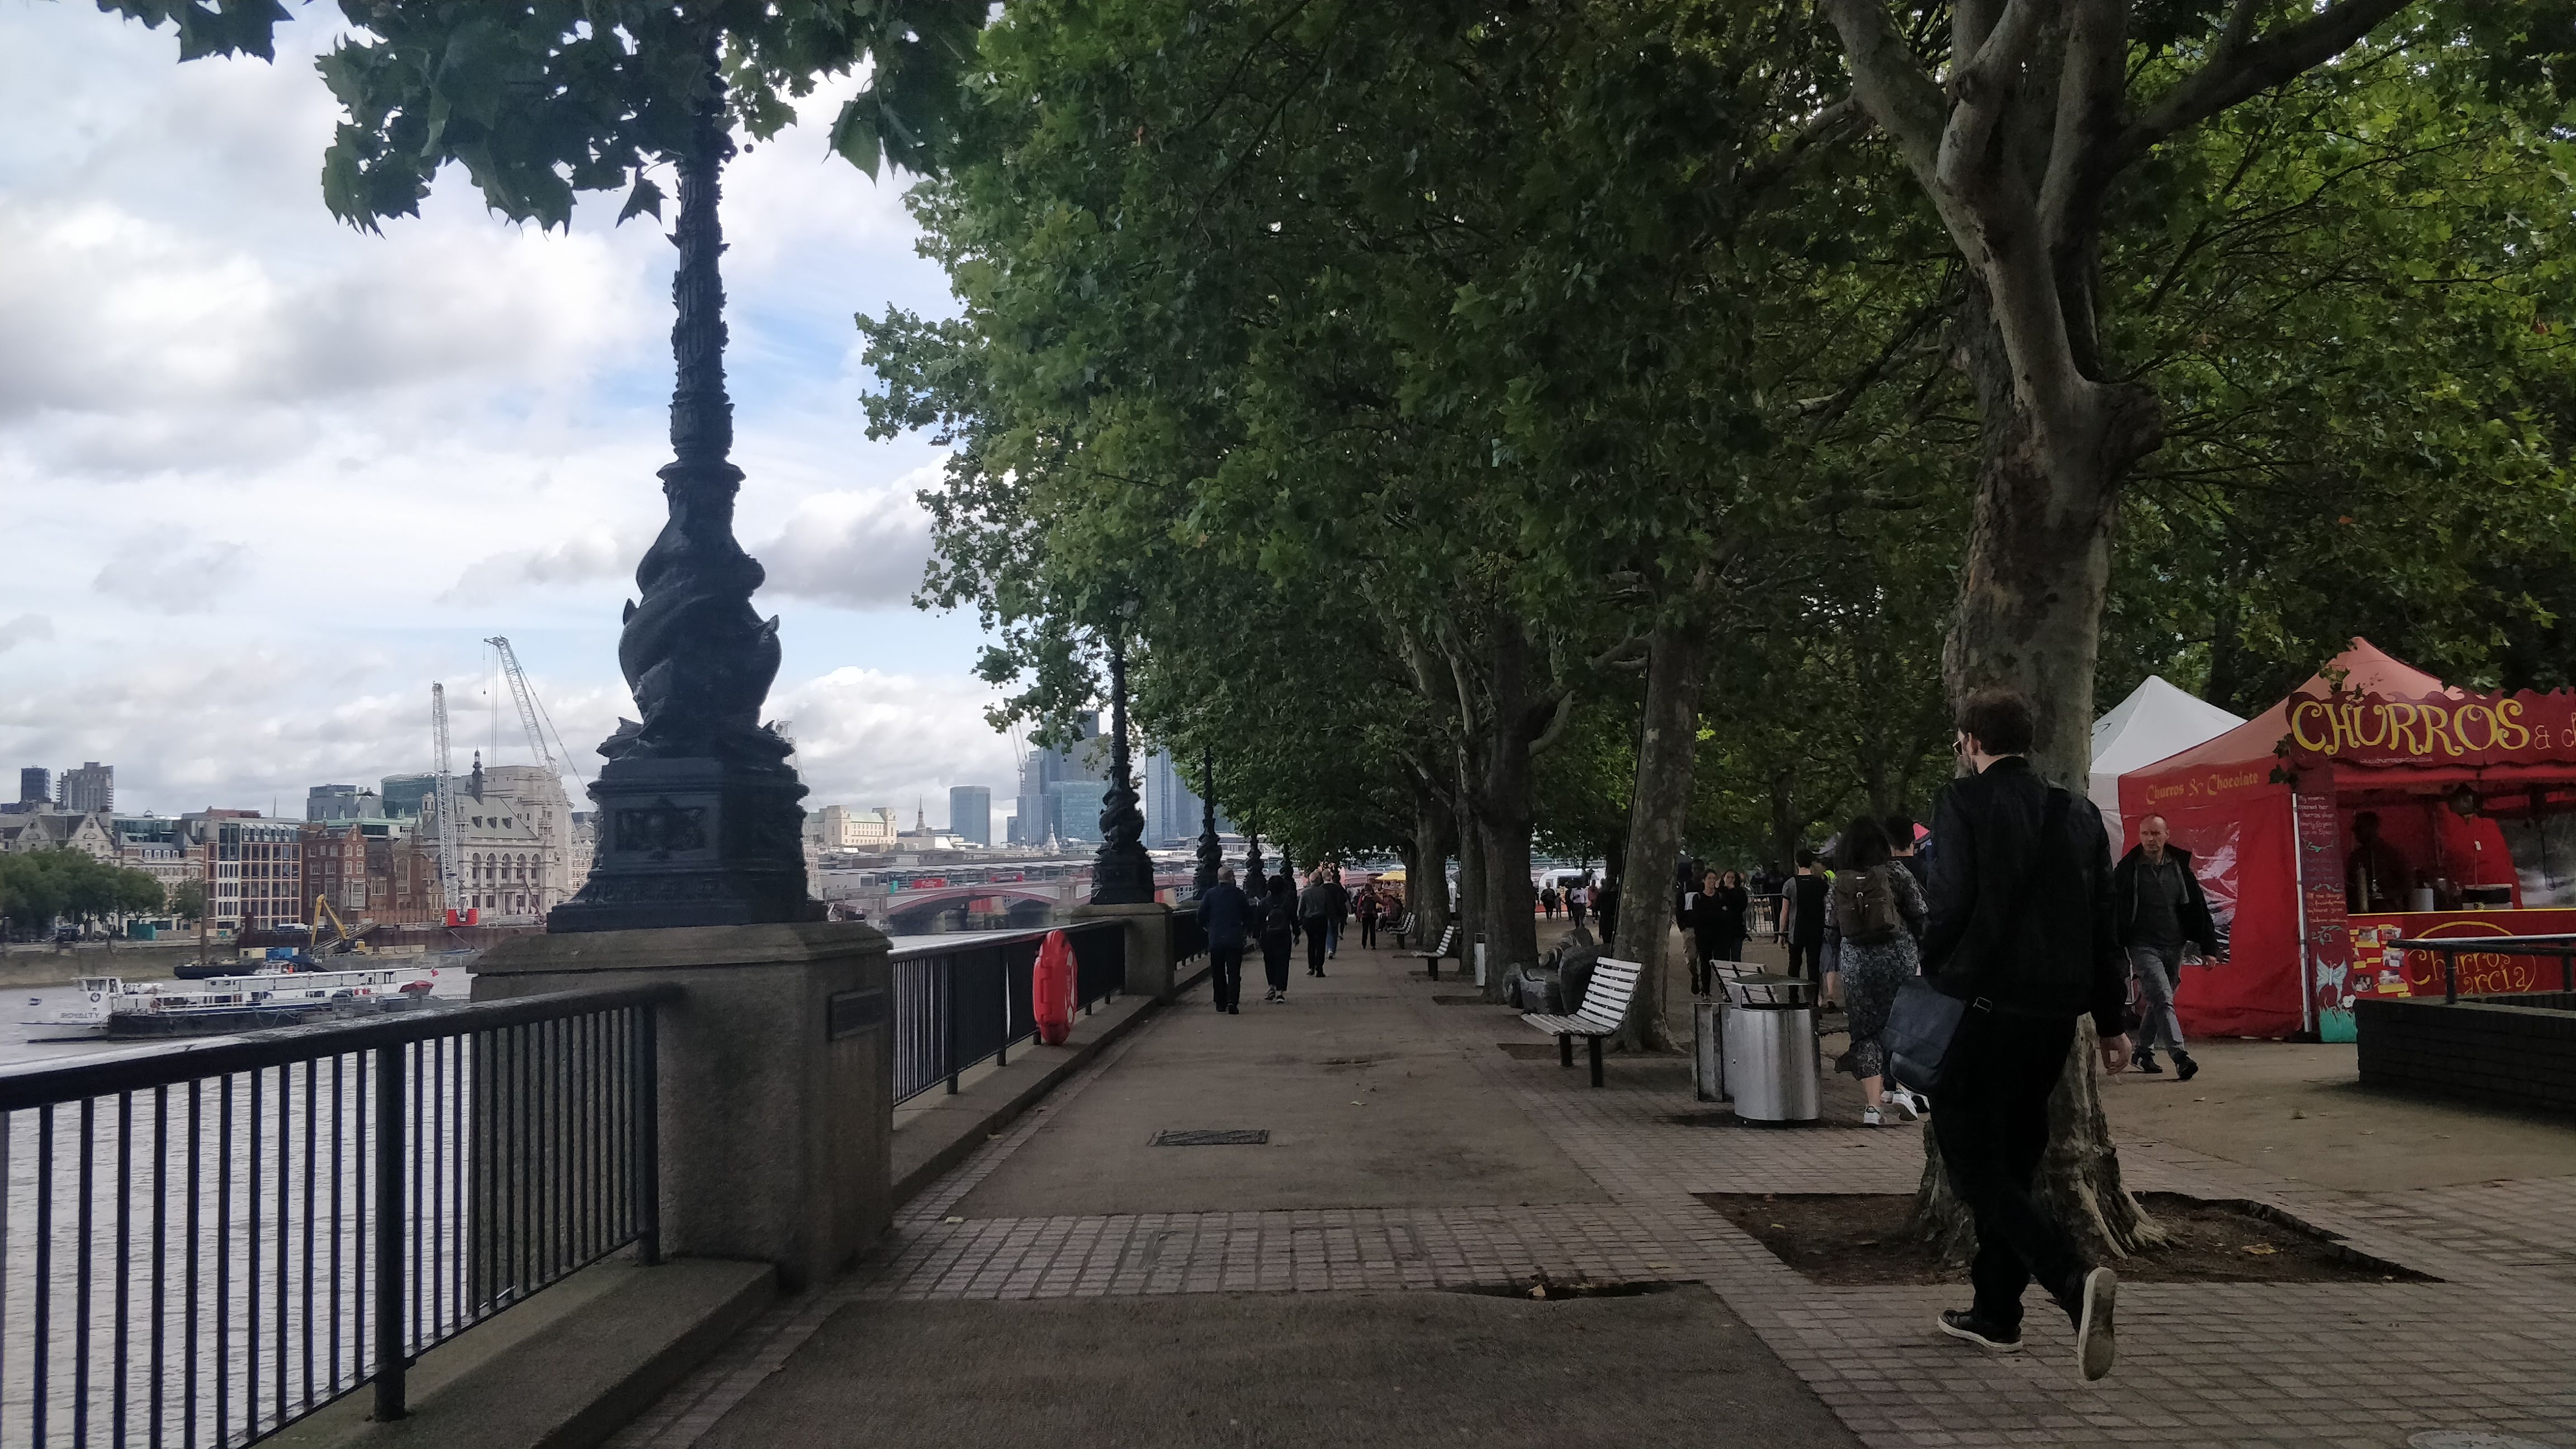
United Kingdom, London
FC-01x Future Cities (Self-Paced) - Exercise 1 : "Making the Invisible - Visible"

Uploaded on 2020-06-21 by Jack Strange
The visible information in this image is varied; it includes the green walkway for pedestrians, the river to the left, and the shops in the right. From this we can extract 'invisible information. For example, being a commuter route, we can understand travel behaviours, like at what are the peak times of usage, and what modes of transport are used along it(skateboards, roller-skates, etc). As well as this, as there are verndors scattered along the Riverwalk, we are able to gather economic data, about how money is spent in that area, and at what times. Visualised, this will be able to see if the shops are successful, how they can be improved, etc. The data on the use of the Riverwalk can provide ways on how this use of land can contribute to the planning of a more liveable space. For example, in summer, due to the warmer climate, the open space will be used more often. Due to this increased demand for the outdoors, it could be suggested that this narrow riverside walk could be widened, accommodating this increased demand. This would also have positive secondary effects, as there are more photosynthetic organisms, 'purifying' the air