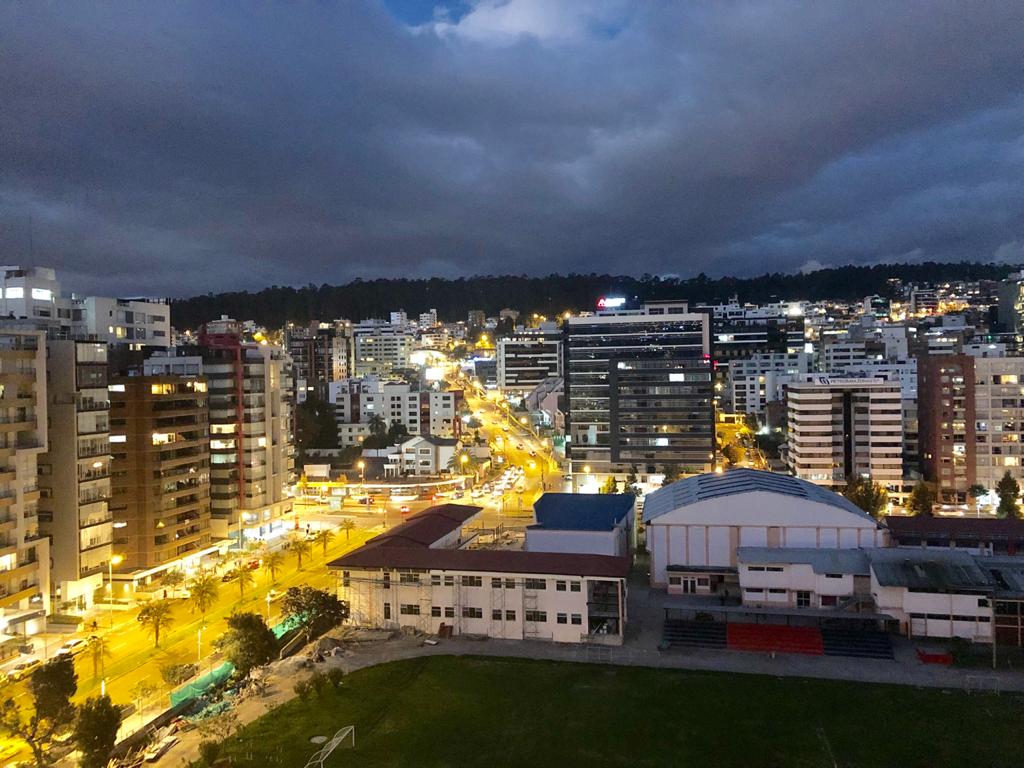
Ecuador, Quito
FC-01x Future Cities (Self-Paced) - Exercise 1 : "Making the Invisible - Visible"

Uploaded on 2020-06-05 by Cristina Gallardo
In the picture we can see a couple of invisible data that can be used to determine more analysis. we can see the time of day, traffic, people movement as well as lights on buildings. This data can be used to analyse this is a more commercial area of the city. Buildings with lights out can indicate these buildings are used for commercial purposes and not residential. Traffic flow indicates how because of the time of day, could be closed and therefore not have much traffic around. these analysis can be used to determine more visual data like working habits of people, movement patterns around the area as well as flow of people and can be used to further enhance this part of town. Adding more traffic signs, figuring out how to lower traffic like bigger streets or even adding residential zones around to further develop the commercial area.