Uploaded on 2020-04-08 by Olga Vitkovska
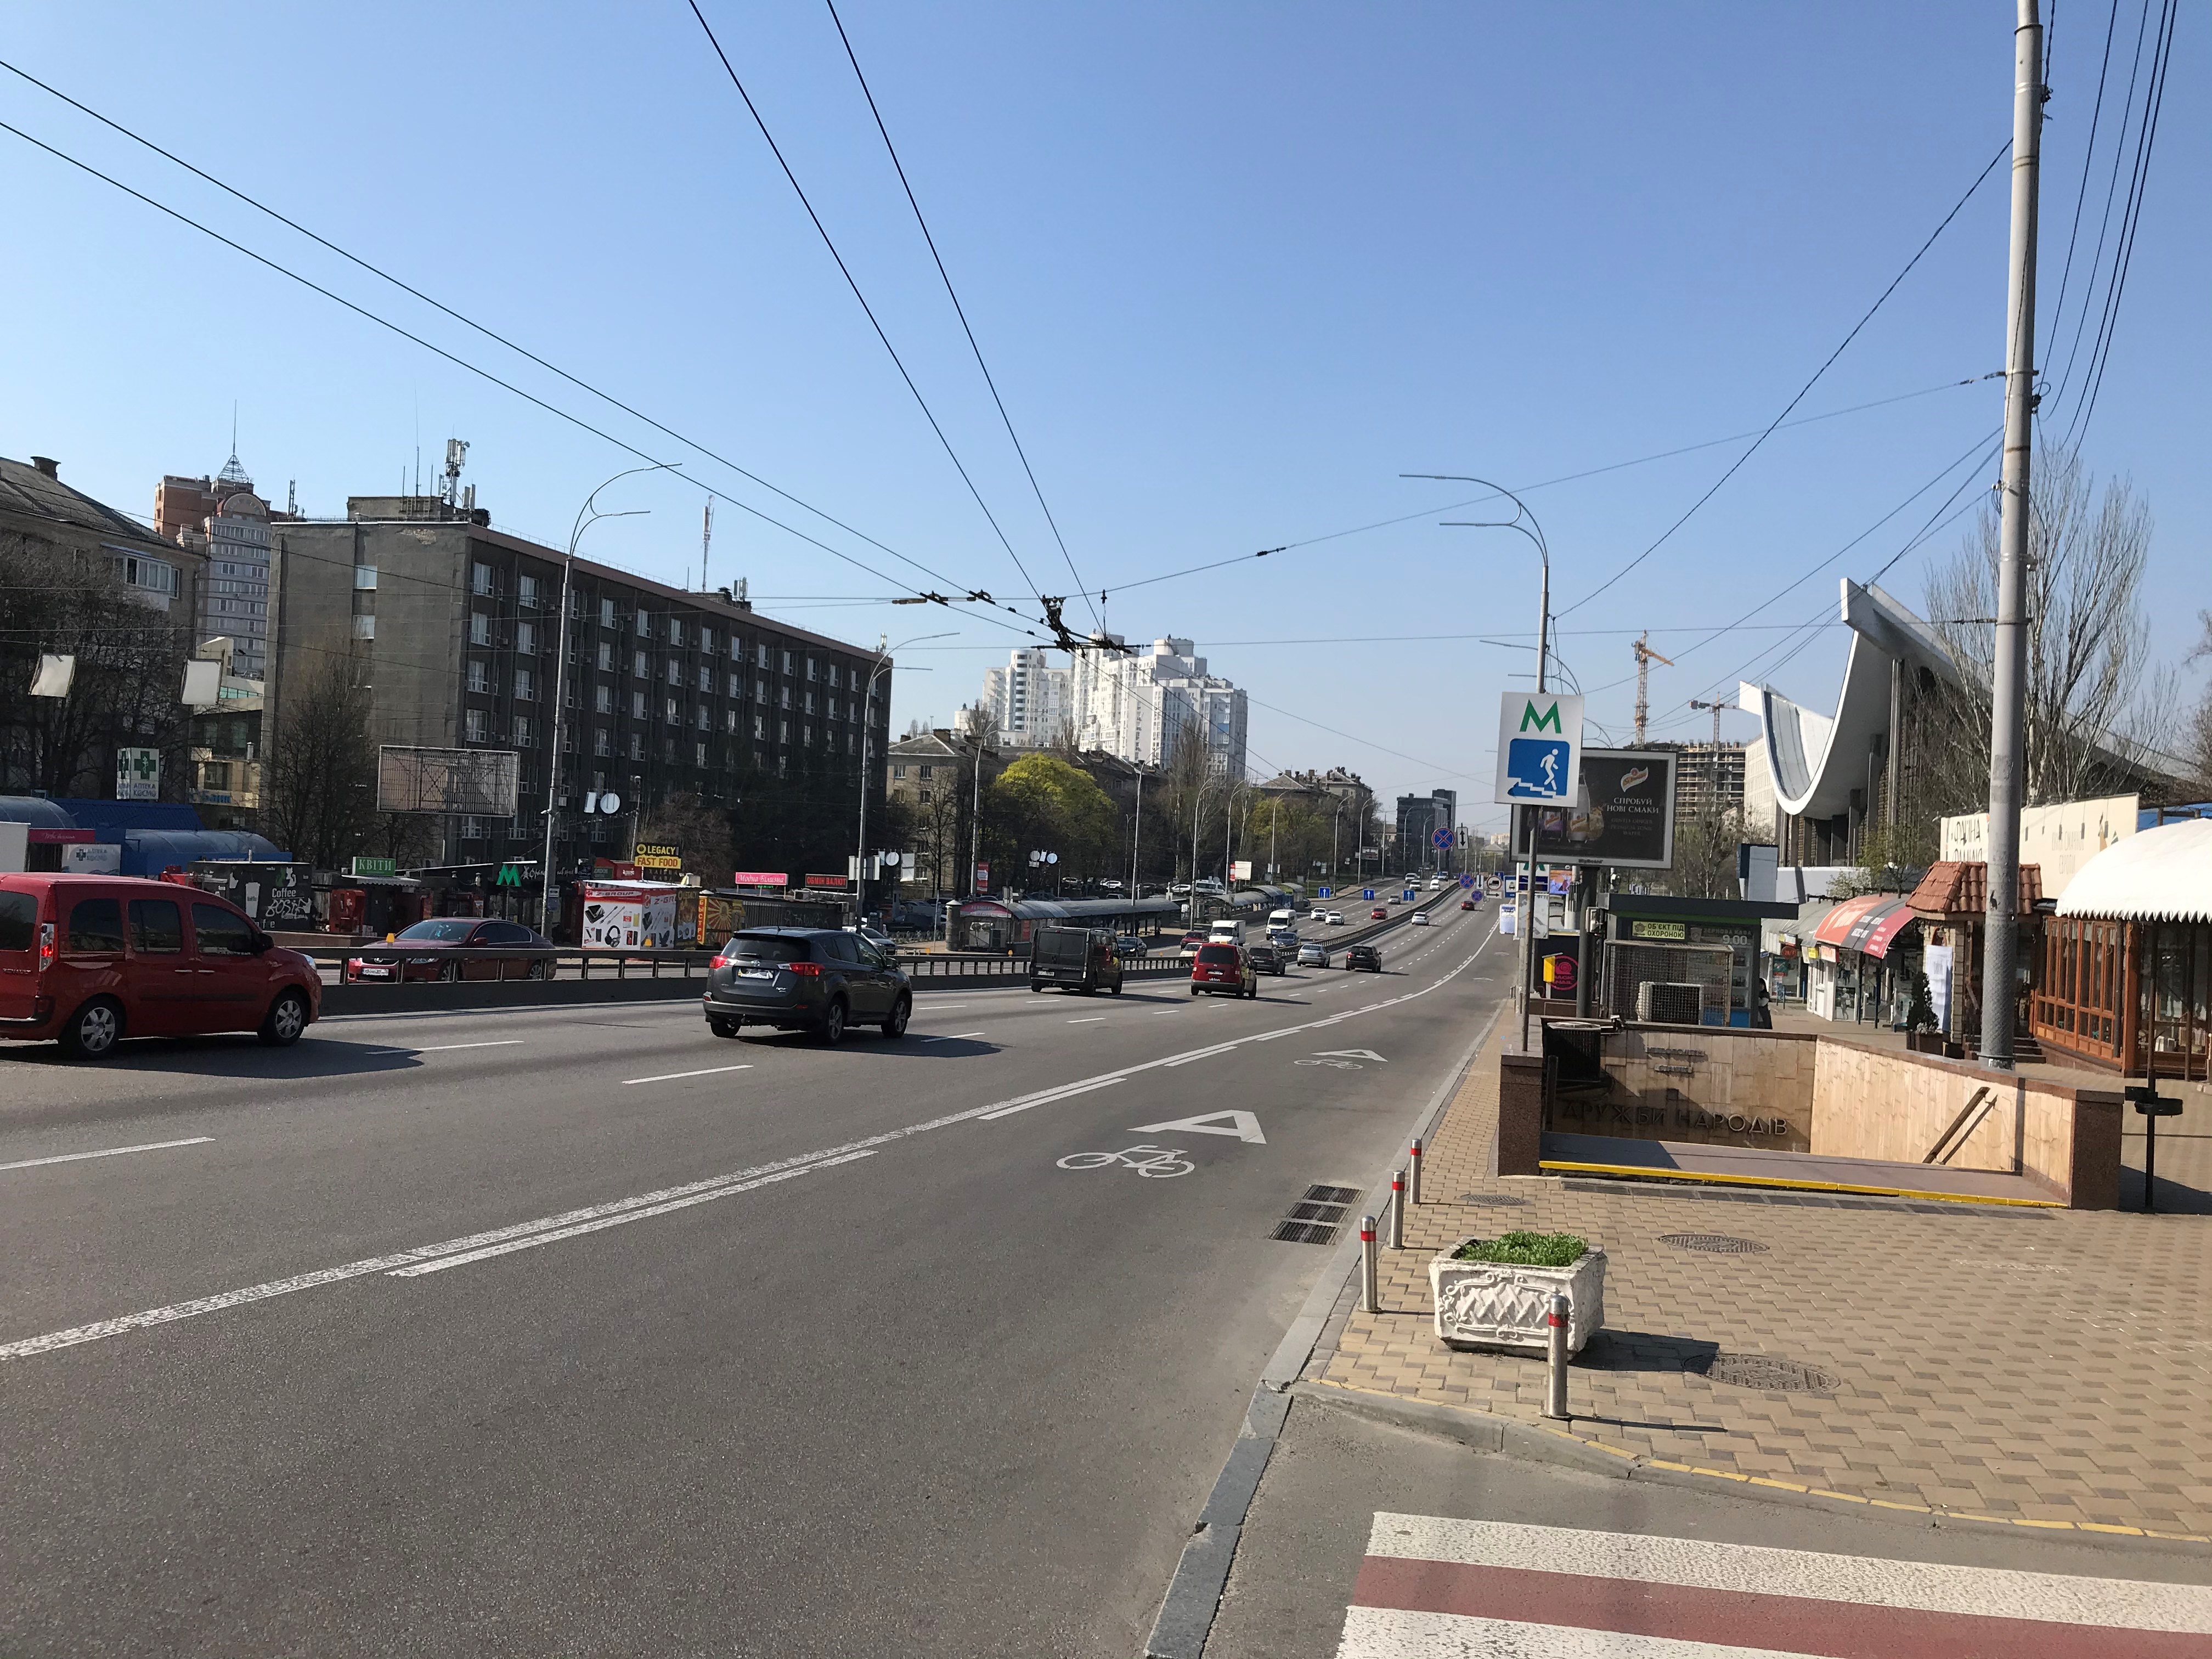
The visible items here are: an entrance to the underground station, bus stops, the separate lane for public transport and bicycles, residential and non-residential buildings. The invisible information I will focus on: traffic and air pollution. The data may include how many vehicles pass this spot, when exactly it is the busiest, what the average speed is, how many cars break the rules and use the public transport lane, how many people use the public transport at these stops and when. The second piece of invisible information is the air quality, and how it changes during the time of the days, weeks or months. Knowing the number of vehicles passing through this area during certain times of the day may help to re-distribute traffic among the neighboring smaller streets with the help of applications, like Google Maps, and/or adjust the duration of traffic lights. Knowing the number of private vehicles using the public lane may help to understand how this decreases the efficiency of the public transportation and number of cyclers using this lane. This information can help model solutions to increase the efficiency of public transport and influence decisions made by municipal authorities regarding traffic regulations and public transportation.