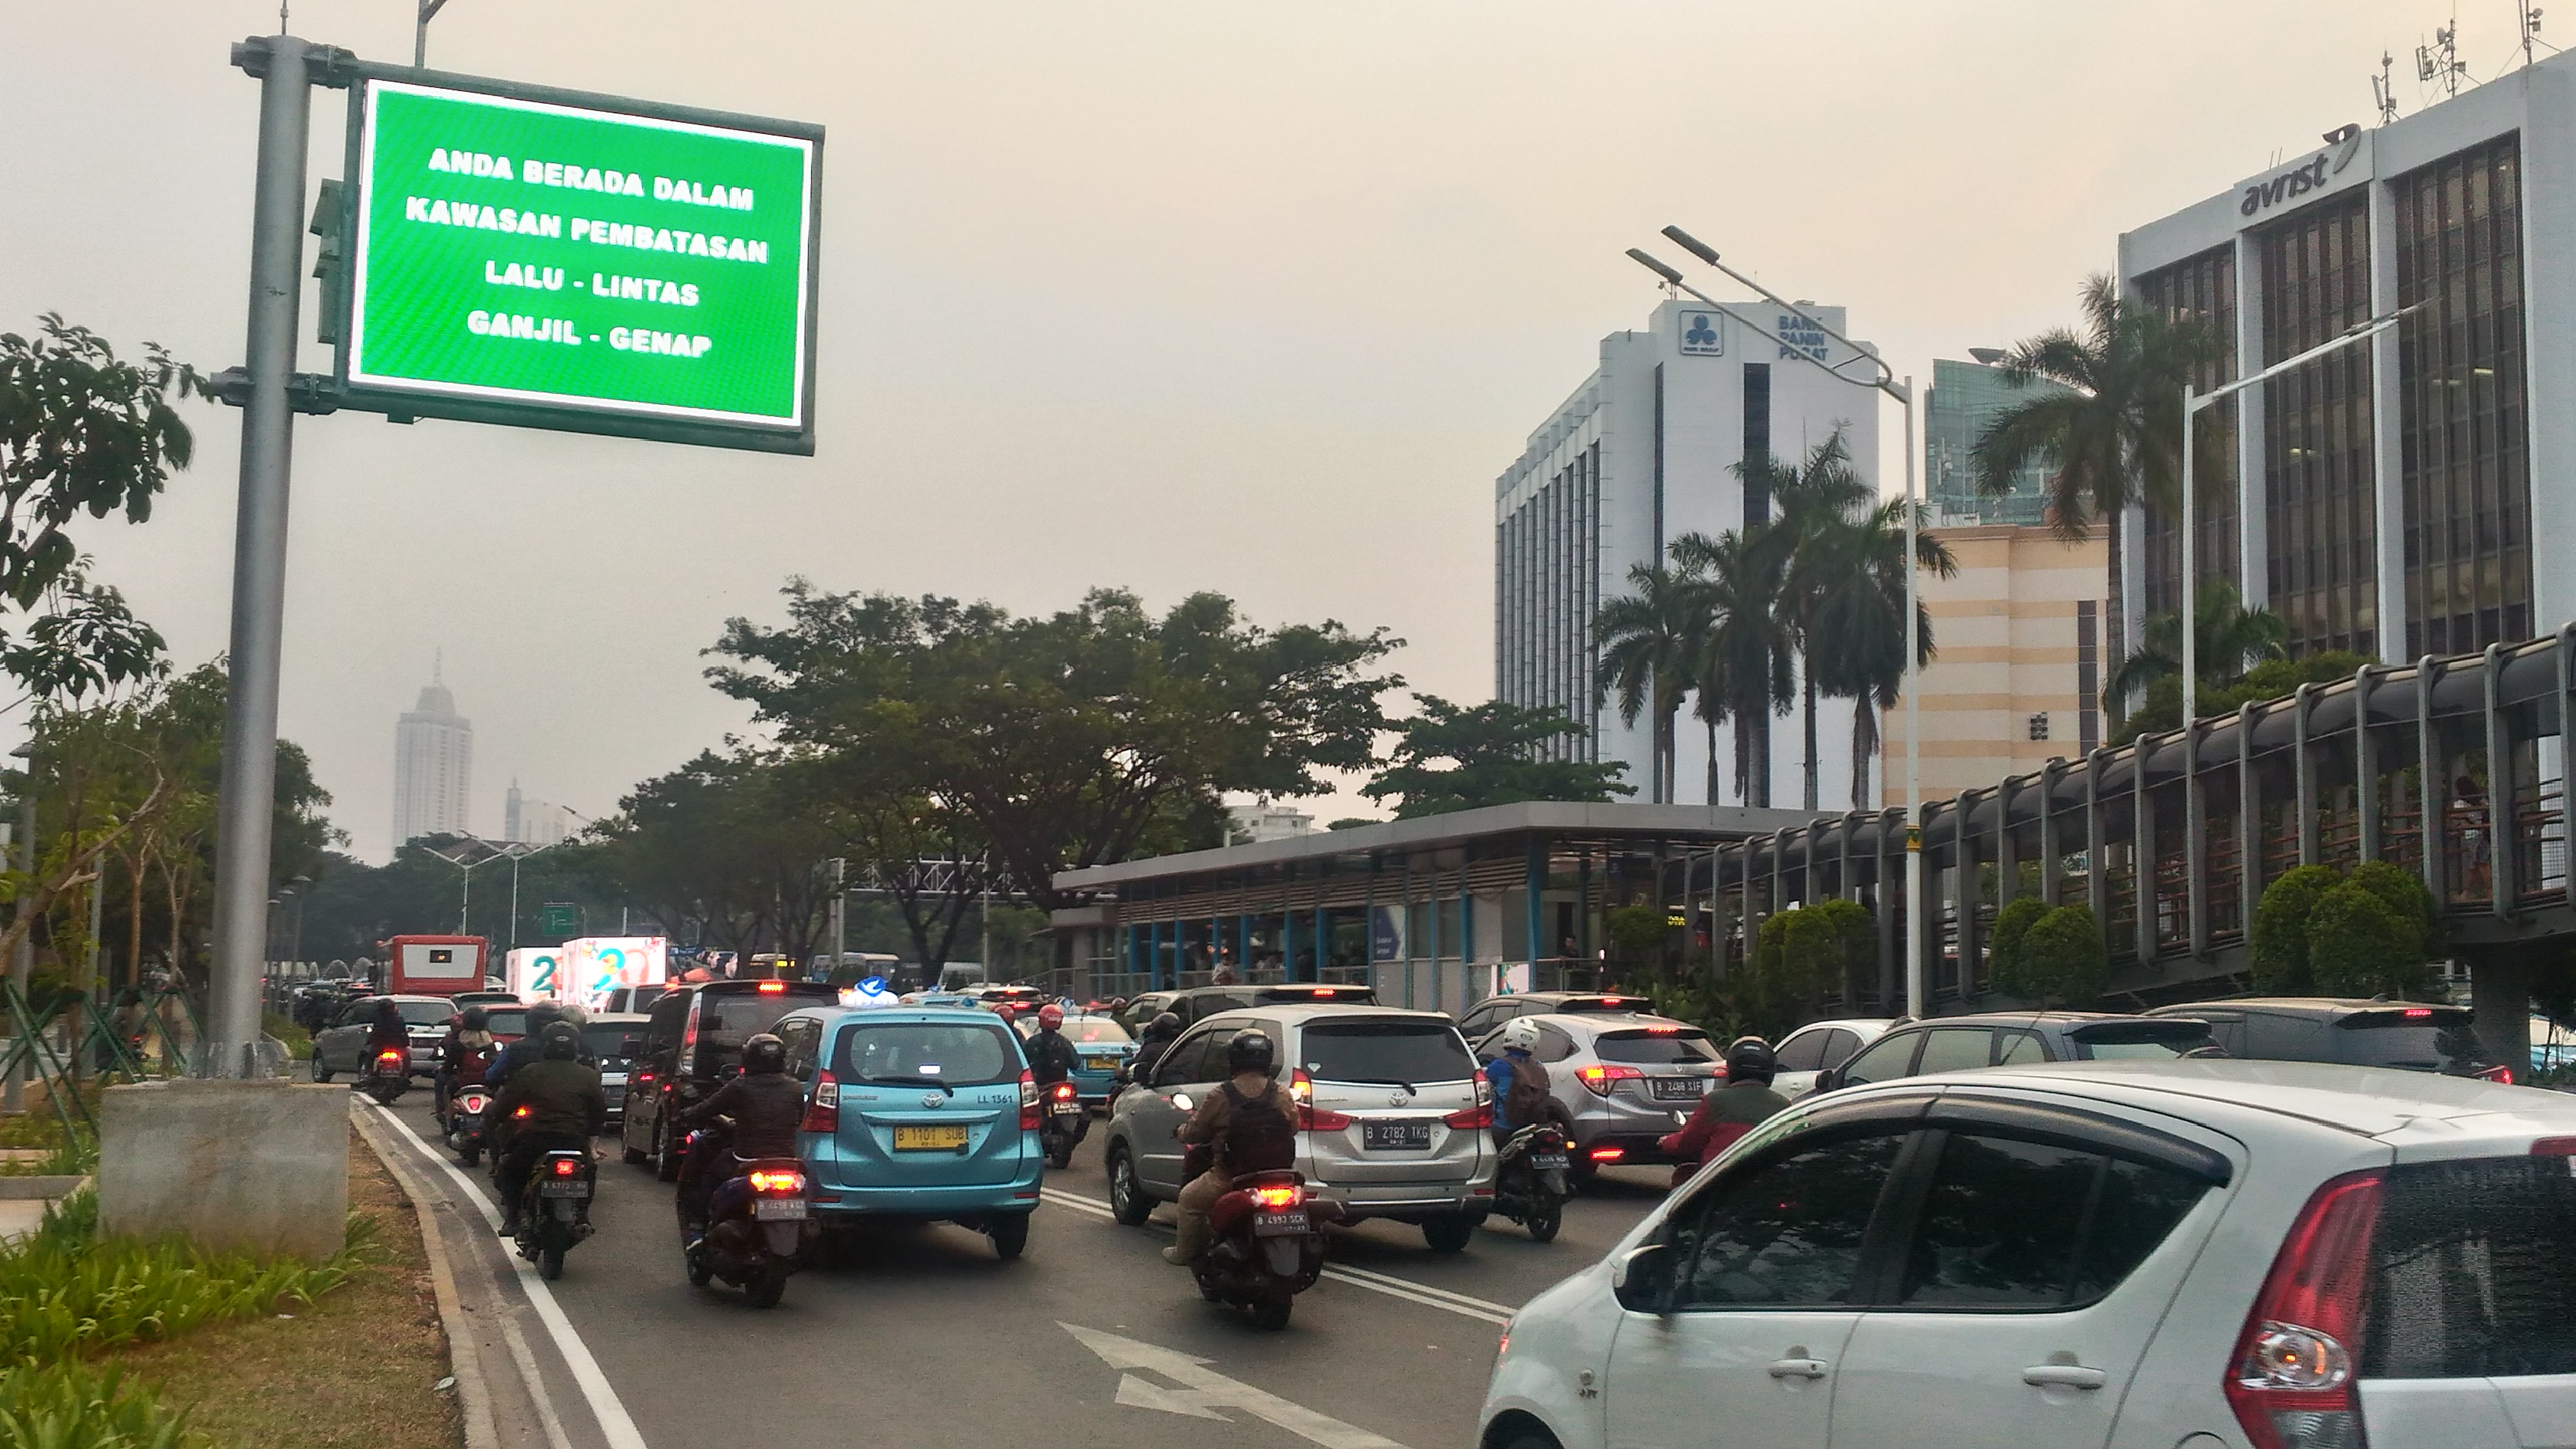
Indonesia, Jakarta
FC-01x Future Cities (Self-Paced) - Exercise 1 : "Making the Invisible - Visible"

Uploaded on 2019-07-03 by edX Student
The photo shows automobiles and motorbikes at an intersection during rush hour. In the area, there are also public transportation - a BRT station (in the picture), and a bus stop and an MRT station (not shown in the frame). A lot of people and cars pass by this area every day. Using for example, mobile phone signals, or surveillance cameras, will show us which modes of transport and at which hours, are in demand, including the direction of traffic (example, are people going to the bus stop or BRT/MRT station or the offices nearby; are cars moving south, north, east or west). Related to the flow of traffic is data on air pollution - the level of air pollution during peak hours when the roads are congested, and the level during off-peak hours. We can compare and check whether pollution levels breach the maximum threshold and is affecting the health of people passing by, and living around, this area. Using information on traffic flow, we can improve the bus, BRT and MRT schedules. We can also install smart traffic lights that respond to traffic flow, to manage congestion during peak hours.