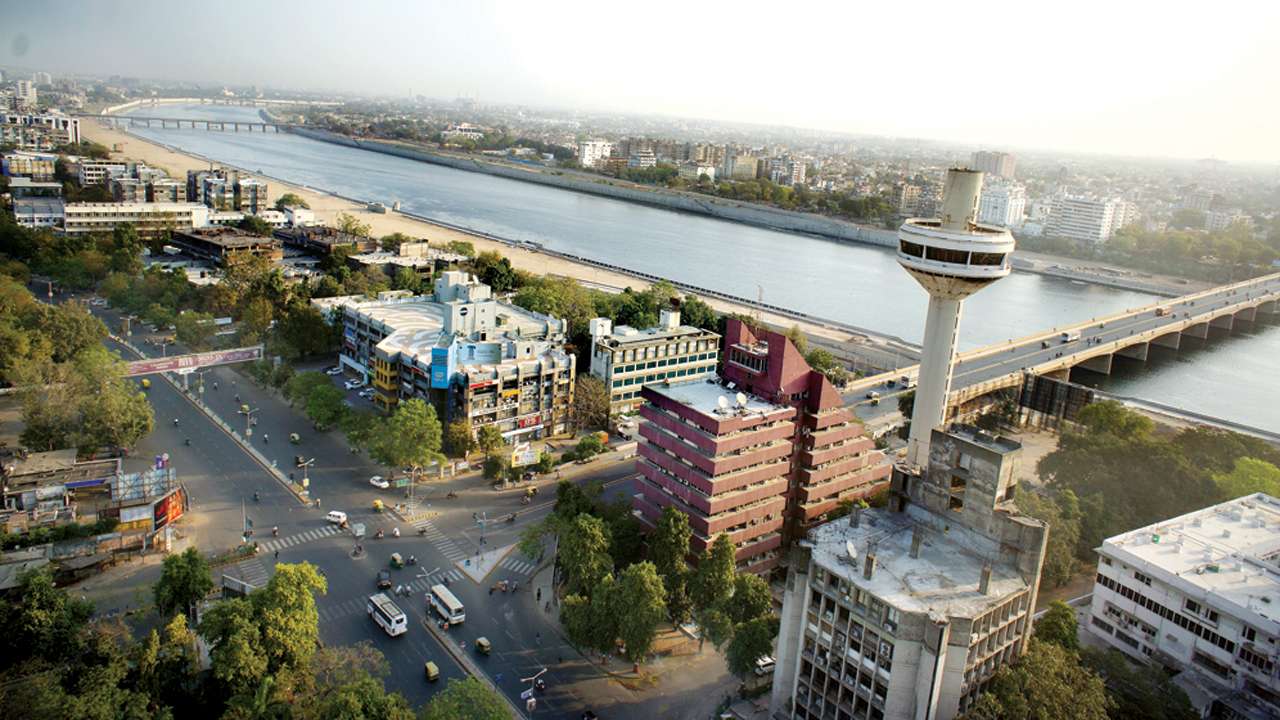
India, Ahmedabad
FC-01x Future Cities (Self-Paced) - Exercise 1 : "Making the Invisible - Visible"

Uploaded on 2018-05-27 by Maitri Pujara
The picture is taken from a high rise residential tower, which shows certain examples of invisible and visible data discussed in previous lectures. The picture covers the developed urban fabric adjacent to Sabarmati river. There are certain catchment areas on the periphery of this riverbank which are being highly used by the people through out the day. Traffic is one of the visible data which we can extract from this picture. By visual observations, it is seen that traffic density in this area is lower in compare to other urban areas in ahmedabad. The cameras are installed on cross roads which can track certain data and activities throughout the day such as, number of vehicles passed by, number of users, movement. The other invisible data can be the catchment areas created because of Sabarmati riverbank. How people are using this particular area in their everyday life. Certain refreshment activities have taken place to make this place more liveable. Taking traffic cameras as one of the invisible data, we can extract user's movement and traffic density related information trough them. The information about number of vehicles passed by and users which give knowledge about average usage of this area.