Uploaded on 2018-01-20 by Halvor Bjørnstad
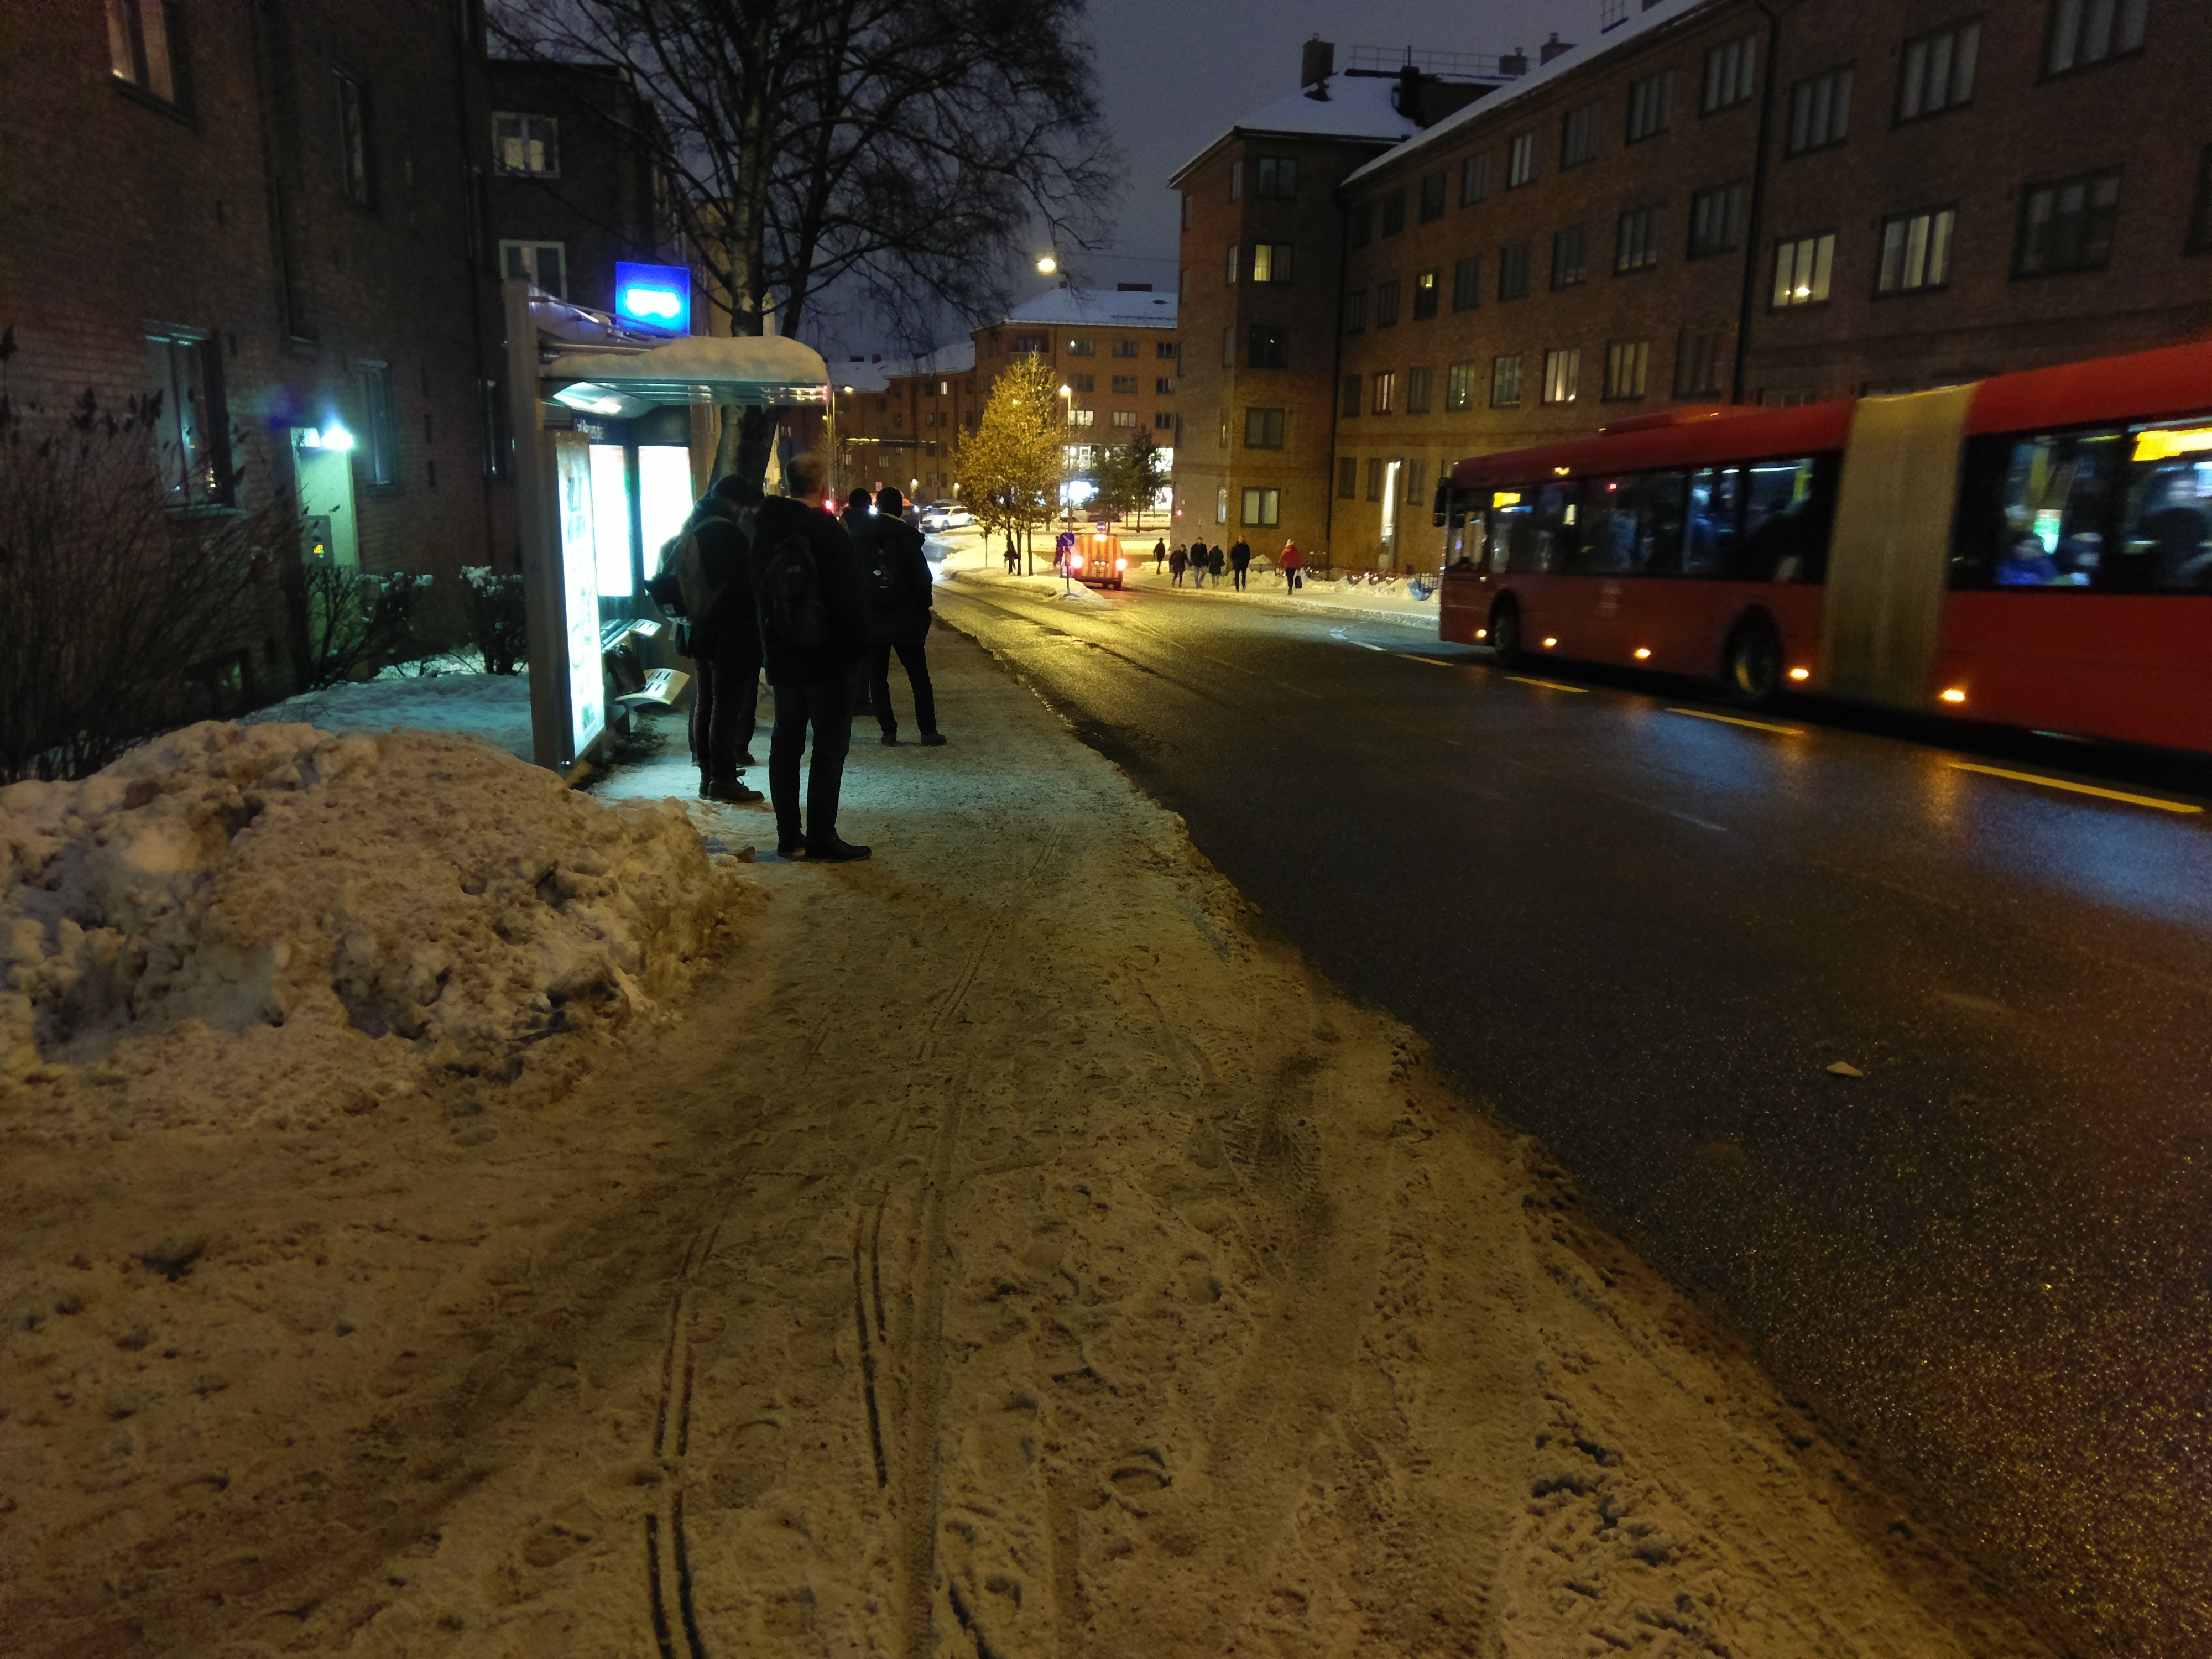
1. In this picture we can see how many people are waiting for the bus at this moment at the bus stop. We can also see the amount of traffic at the time the picture was taken. On the other side of the road we can see the kind of bus that is driving this route. The amount of snow on the ground gives us information about what part of the road is more accessible. 2. From the visible information we can extract that the bus is stopping here, but information about how often the bus stops is invisible. We can see that the snow is plowed, but the information about how the prioritization of plowing the sidewalk is invisible. 3. If we study how many people are taking the bus from this stop and when most people are waiting here we can get knowledge about the usage of the bus stop. That knowledge can be used to adjust on what frequency the bus stops here. The frequency can be adjusted so that the passengers don´t have to wait too long or the buses coming to often generating unnecessary traffic, and thus making the urban space more livable.