Uploaded on 2017-06-17 by Mohammad Ebrahim Ghadam Al Soltany
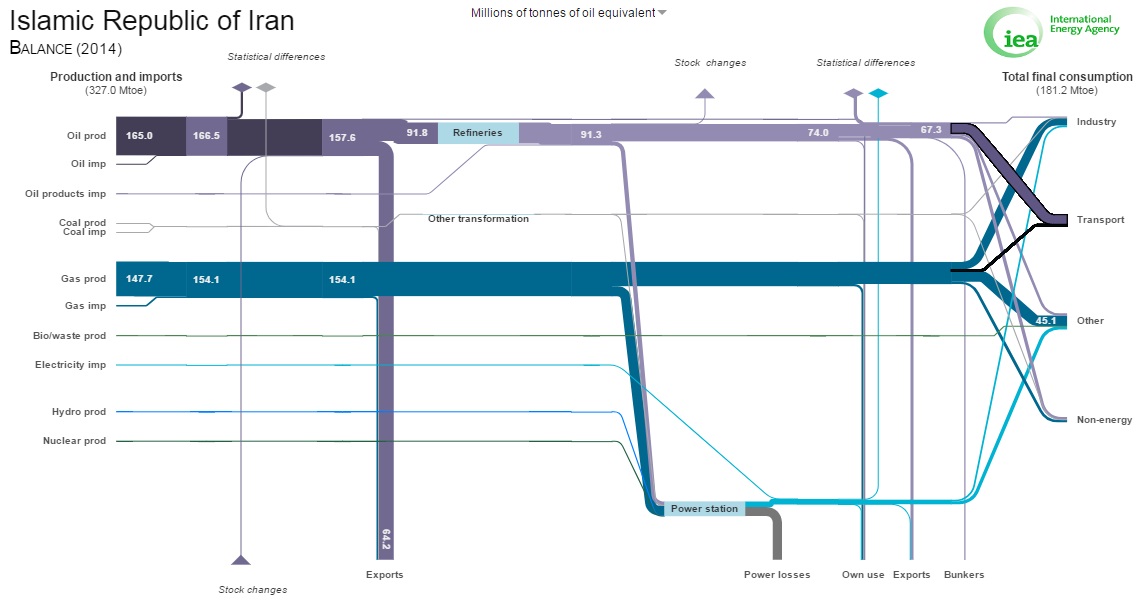
The country that i investigate to make useful information around energy consumption is Iran. as a target to reduce CO2 emissions , we should find dominant energy sources as well as where they consume. 1) The dominant energy source in Iran sankey diagram is Oil productions with 165 mtoe in a scale of total production with 327 mtoe. after oil production in the second level of source of energy production , there is Gas production with 147.7 mtoe . all of surveys is about 2014. 2) The most consumer sector in this diagram is transport with 47.4 mtoe in a scale of total consumption with 181.2 mtoe. 3) as you can see in the diagram , we have a lot of power looses in the converter of the gas energy to the electricity energy by 38.5 mtoe. this is a large proportion of total energy consumption as well as energy production. I think we should focus on renewable energy , because of both our disaster in changing climate in middle east and significance of Iran location , which made a great opportunity to convert solar energy to electricity , without any loose energy or co2 emissions. In the other hand, we should focus on development of our nuclear plants , because we have great potential in this sector , also we have enough resources ion our country to feed our nuclear plants.