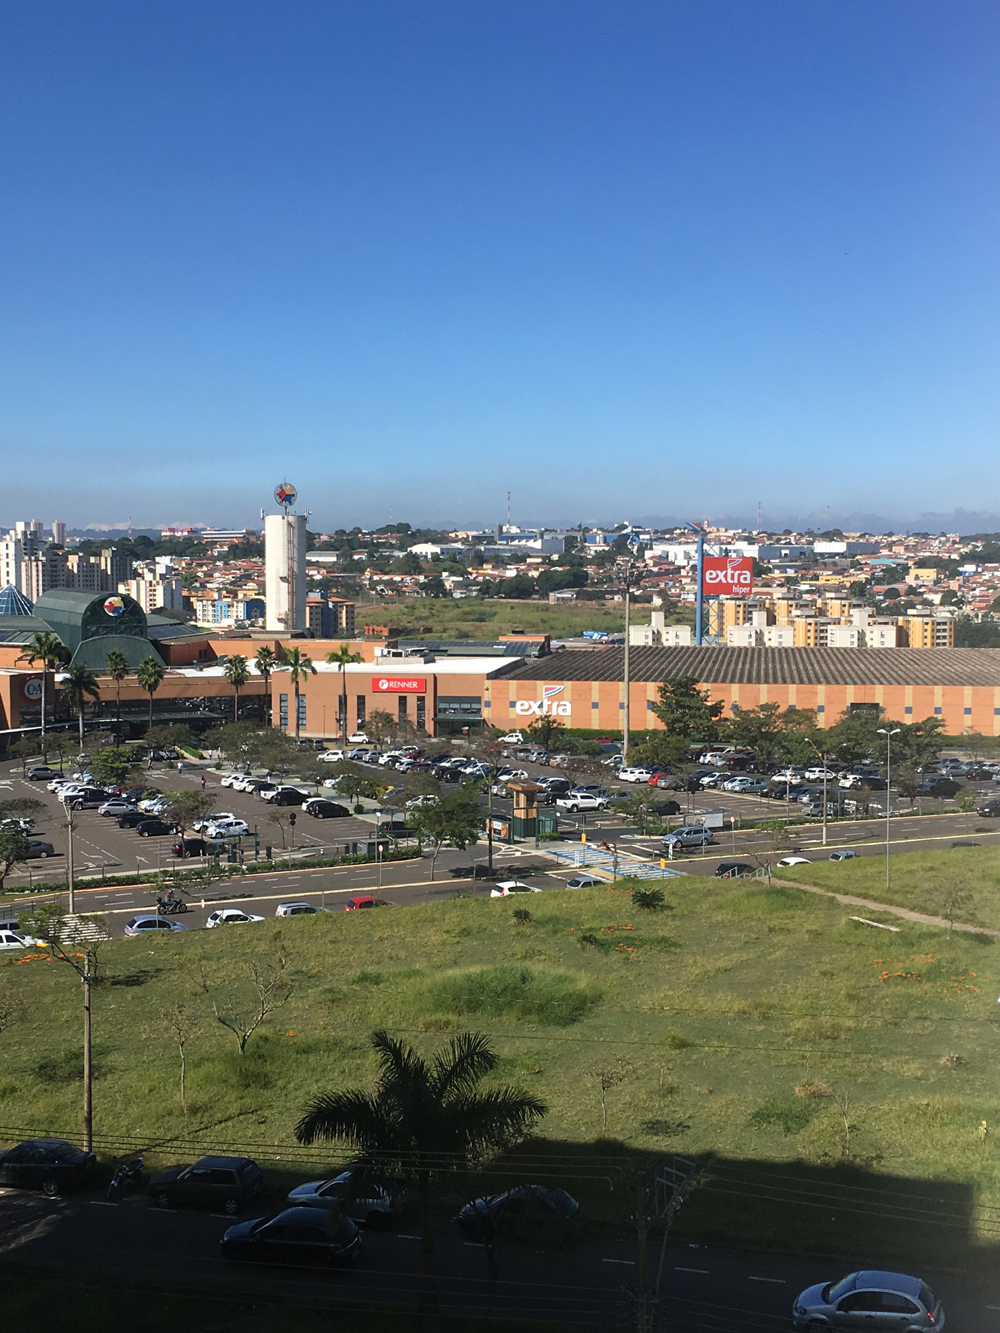
Brazil, São Carlos
FC-01x Future Cities (Self-Paced) - Exercise 1 : "Making the Invisible - Visible"

Uploaded on 2017-06-16 by Lara Kovacs
This picture is from a shopping mall and the neighborhood is sent on. On this picture you can see an amount of visible information, such as cars, buildings, streets, trees and vegetation, access, Building heights, people and flow direction. Using the visible information you can great invisible data such as the number of people that goes to this place at certain times and days of the week, how these people get there (walking, by car, by bus), peak times. Considering the neighborhood, you create the invisible information of the variety of the buildings, their high and their use, being able to recognize the uses, residential, commercial, institutional, industrial, empty spaces. The invisible information helps to manage the flows of the city, knowing that an area is residential you need to create a network of service to the people that lives there, if you have an intense flow of cars you need better streets and large ones, if lots of people are going to the mall, you need better ways to get there, more lines of public transportation, sidewalks, vegetation and illumination, safety. With the right data is possible to create a more human city, built by the needs of the population, when analyzing visible and invisible information you see facts and not statistics.