Canada, Montréal
FC-01x Future Cities (Self-Paced) - Exercise 1 : "Making the Invisible - Visible"

Uploaded on 2017-05-29 by Boston (by Nicholas Swedberg)
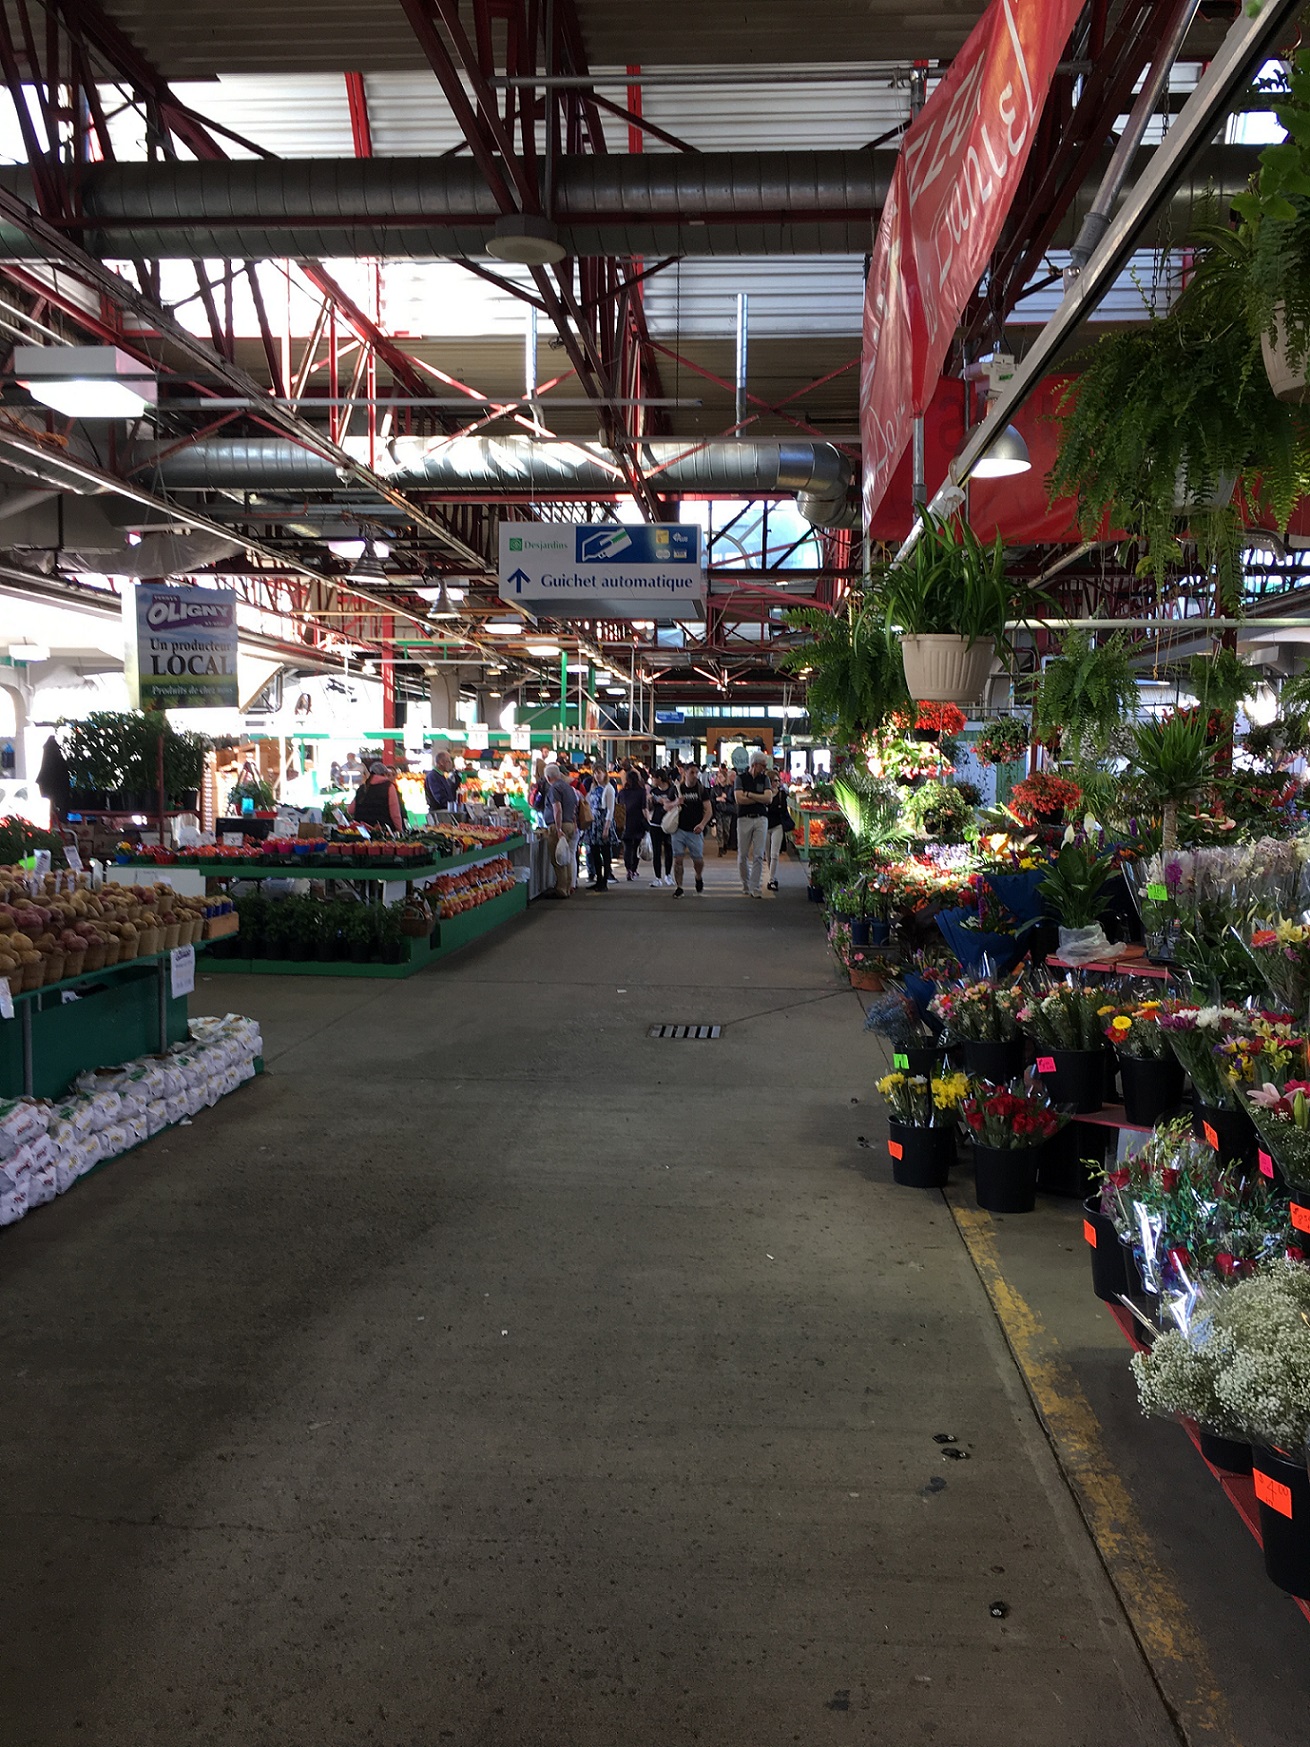
Le Marché Jean-Talon (Montréal, Canada) The Marché Jean-Talon is a public agricultural market in Montréal, Canada. The Marché is an open air, covered market at which vendors sell a variety of goods ranging from fruits and vegetables to flowers and pastries. Many of the agricultural goods are sourced from the various areas in the province of Québec. The Marché Jean-Talon provides the urban citizens of Montréal access to the goods of the province. The attached image of the Marché displays numerous points of visible information. Visible information highlighted in the image includes the number of people in the market, the variety of goods available for sale, the quantity of goods available for sale, and the retail price of the various products. Of course, this visible information regarding the quantity of people and goods is tied to a specific moment in time. While the image highlights a range of visible data, there is also an abundance of invisible information that this image implies. The picture shows the number of people in the market at a particular point in time (the aforementioned visible data): the invisible counterpoint is the total number of patrons that frequent the market over the course of the day. If the variable of time is lengthened, we could also examine the number of people that visit the market over the course of a week, month, or an entire year. The number of visitors that frequent the market over a given range of time is a central piece of invisible information inherent in this image. Related to the number of patrons frequenting the market, there is another piece of invisible information related to method of transit that the patrons used to arrive at the market. Some patrons may have ridden the Metro and walked to the market from the station, while others may have ridden a bicycle or a city bus. Perhaps some patrons drove a personal vehicle or rode a taxi. This information about how people arrive at the Marché could be further expanded to examine from which portion of the city they traveled in order to reach the market. This image also implies information about the number and value of daily transactions within the Marché Jean-Talon. This invisible information describes the financial flows within the market. It can categorize the daily, weekly, or monthly financial flows within the market; describe goods that sell well or poorly; and can be used to compare retail values against the required costs of production and transportation. A final piece of invisible information present in this image relates to the goods for sale. There is a plethora of information about the physical source of each of the goods for sale, the energy and resources used to produce the goods, and the energy used to transport the goods to market and store them until their final sale. We can use the data about the number of patrons who visit the Marché over a period of time and the method of transportation that they use to arrive at the market in order to help further develop the livability of Montréal. Understanding the methods of transit people use to reach the Marché could help Montréal planners emphasize or develop the appropriate infrastructures. If, for example, 25% of patrons reached the Marché via bike, but the local area lacked designated bike lanes or sufficient bike parking, planners and designers could work to develop a better biking infrastructure within the area. If 50% of people traveled to the Marché after work via Metro, decision makers could fine tune transit schedules and develop wayfinding tools to ensure that the local Metro stop does not become overcrowded, or that first time visitors can find the Marché. By examining the data about the times patrons choose to visit, the aforementioned design considerations could be further modified to better match use patterns.