New Zealand, Auckland
FC-01x Future Cities (Self-Paced) - Exercise 1 : "Making the Invisible - Visible"

Uploaded on 2017-05-20 by Anna Bulkeley
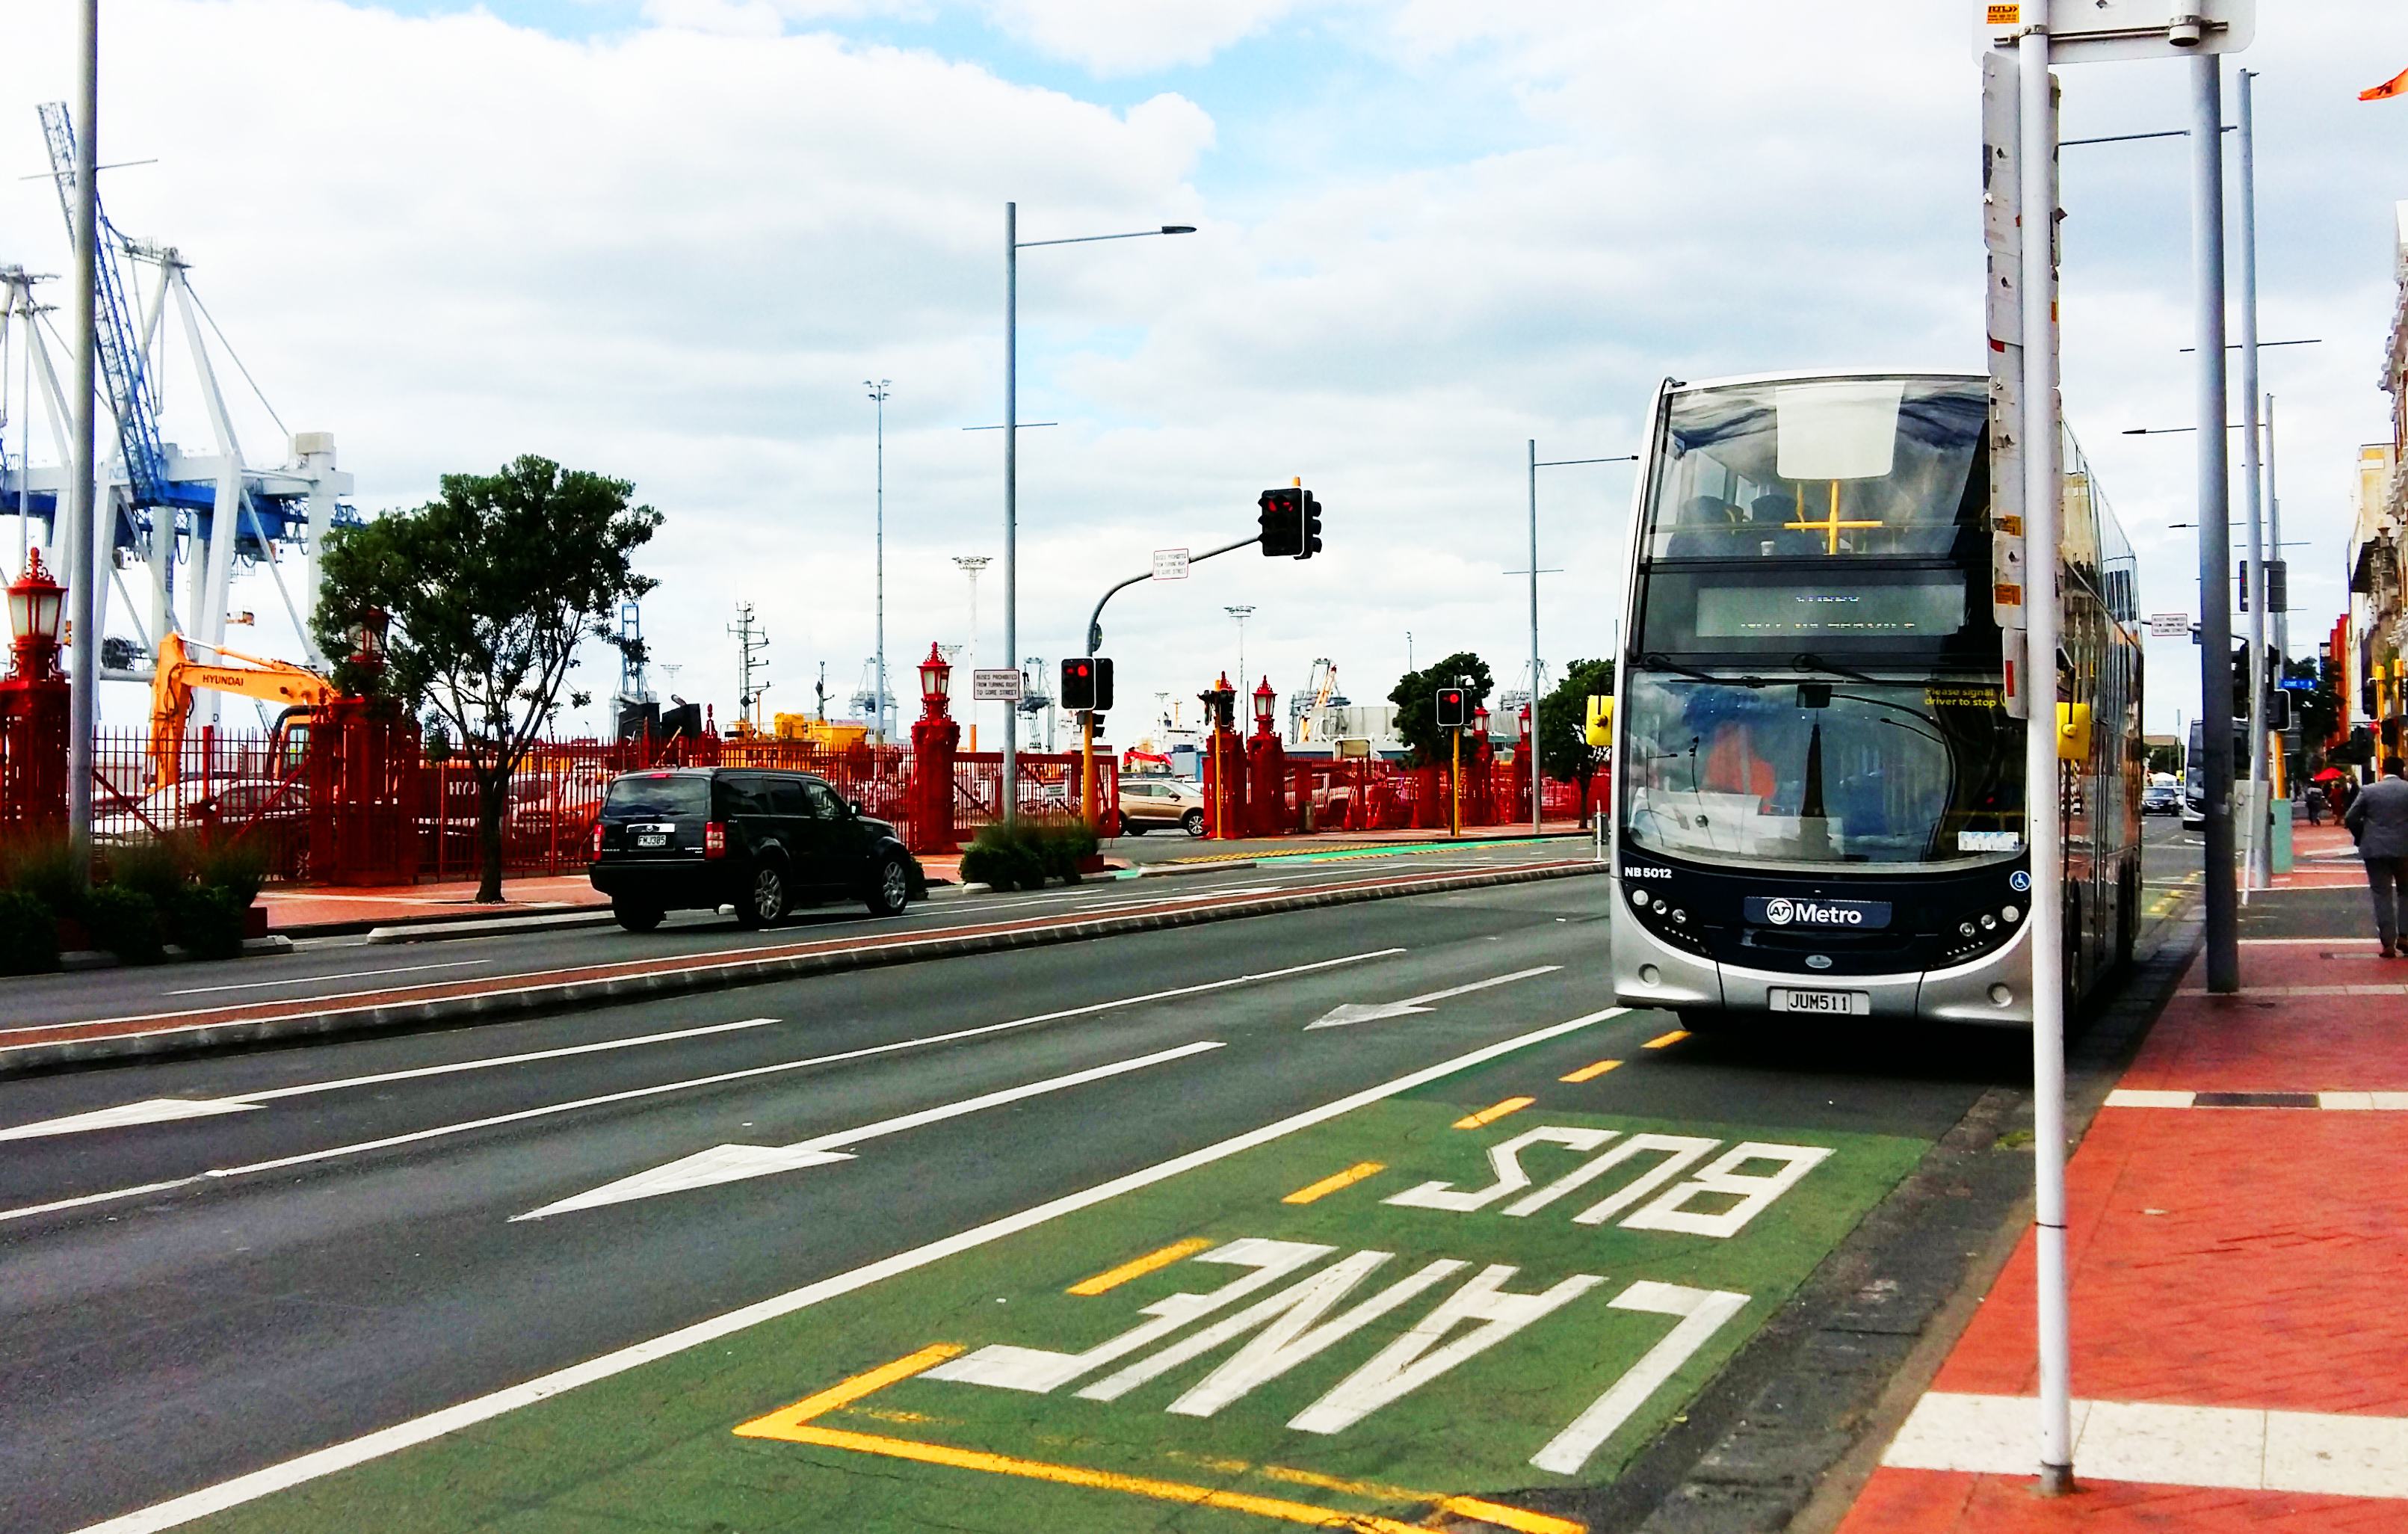
1. Downtown Auckland lies on the Waitemata Harbour. The information that is visible includes transport systems available including cars, ferries, cycle paths, footpaths and includes the port functions to the left. There are traffic lights and specific lanes controlling these transport systems and this indicates the use and purpose of the area at around midday on this particular weekday. We can see frequency of buses and stops and parking restrictions. We see dual-lanes that indicate the high use of this thoroughfare into downtown and signage to control its use. The planting shown indicates the environment and some of its constraints – hard wearing native Pohutukawa trees. It shows that the conditions can be harsh as it is an exposed area full of sea air. It is early autumn, still warm which we can tell by the native trees across the road and the clothing people are wearing. We can see that it is overcast but has been raining. We see this might affect the pedestrians in the area. We can see restricted areas, including parking across the road, noticeable by the red fence and gate. We can see well-worn streets, yet freshly painted which infers frequency and use. We also see heritage aspects such as the fencing and the buildings to the left combined with contemporary means of travel and use. 2. Two pieces of invisible information that might be derived from this photo include the times most people enter this downtown space and the function that those people serve. This data can be easily extracted from AT Hop cards (travel cards) for the buses and ferries. It could also be derived from customs control of the ports that lie behind the red fence. Much like buses, people arrive via cruise ship, yacht, tug boat, container ship. 3. For Auckland in New Zealand, infrastructure is highly topical as we see the city currently growing too rapidly. Let’s take the customs logs. They will record much data such as the sea transportation type, its function, the port origin, the nationalities, ages, races and religions of those entering the Port of Auckland. It will also include times, days and dates. Finally, it will record capacities and occupancy rates on that transportation and spend per capita based on that data. This data becomes information that the local and national transport agencies can use. It also becomes information that the government and tourism agencies can use. Once the information has been applied to the relevant agencies it can disseminated and offer projections for tourism as an example. It gives us the knowledge to aid in budgeting for future infrastructure and the needs of Aucklanders to get to work as an example. It gives us the knowledge to provide accommodation and tourist attractions suited to the demographics arriving. We can plan seasonally for this based on the original data and subsequent invisible information, then knowledge. It also tells us the size of the ships and yachts. It means the marinas can be extended to cope over summer, maybe temporarily. It tells us that cruise liners are getting bigger and carry far more people from far more origins. It tells us we need to expand our wharves and customs terminals. Oh, how I could go on! ANNA BULKELEY - Auckland, New Zealand