Uploaded on 2017-04-30 by Tomoe Kamoshida
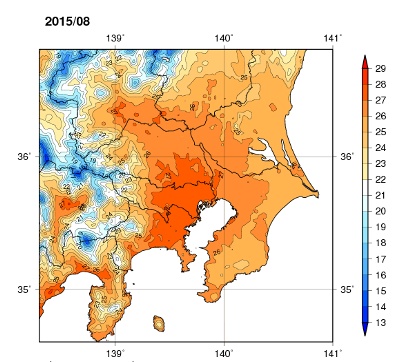
1. No.1 Los Angels up to 24.0 degree/average 7.3 degree/22days above 90°F No.2 Albuquerque up to 22.0 degree/average 5.9 degree/25days above 90°F No.3 Denver up to 23.0 degree/average 4.9 degree/26days above 90°F 2. This distribution map shows average temperature of Tokyo and surroundings in August 2015. (ref. http://www.jma.go.jp/jma/indexe.html http://www.data.jma.go.jp/cpdinfo/himr/h28/chapter2.pdf *Japanese only) The capital of Tokyo where is red zone in the map while my residential area 40minute away from the central of Tokyo by train is orange zone between 27-25 degree. That would be better to live than Tokyo has been affected all day even during the night time. 3. As I say, my city is still hotter than rural areas the caused by the business district affecting that has to reduce the energy consumption especially electricity. We attacked earthquake 2011. After mass, we had to reduce by the temporary restriction the electricity. It would have been continuing if it effected UHI as well. One more thing is that pavement materials should product adapting to the city more efficiency. 4. The new high buildings in Tokyo were designed solar gain usage by facade and long wave heat reduced by the materials. Also winds fluid utilization is to keep inside cool against the energy loss by mechanicals. In architecture measurement, there are regulation by LEED in the world CASBEE in Japan.