Uploaded on 2016-06-29 by Alejandro Juan Pineda Sánchez
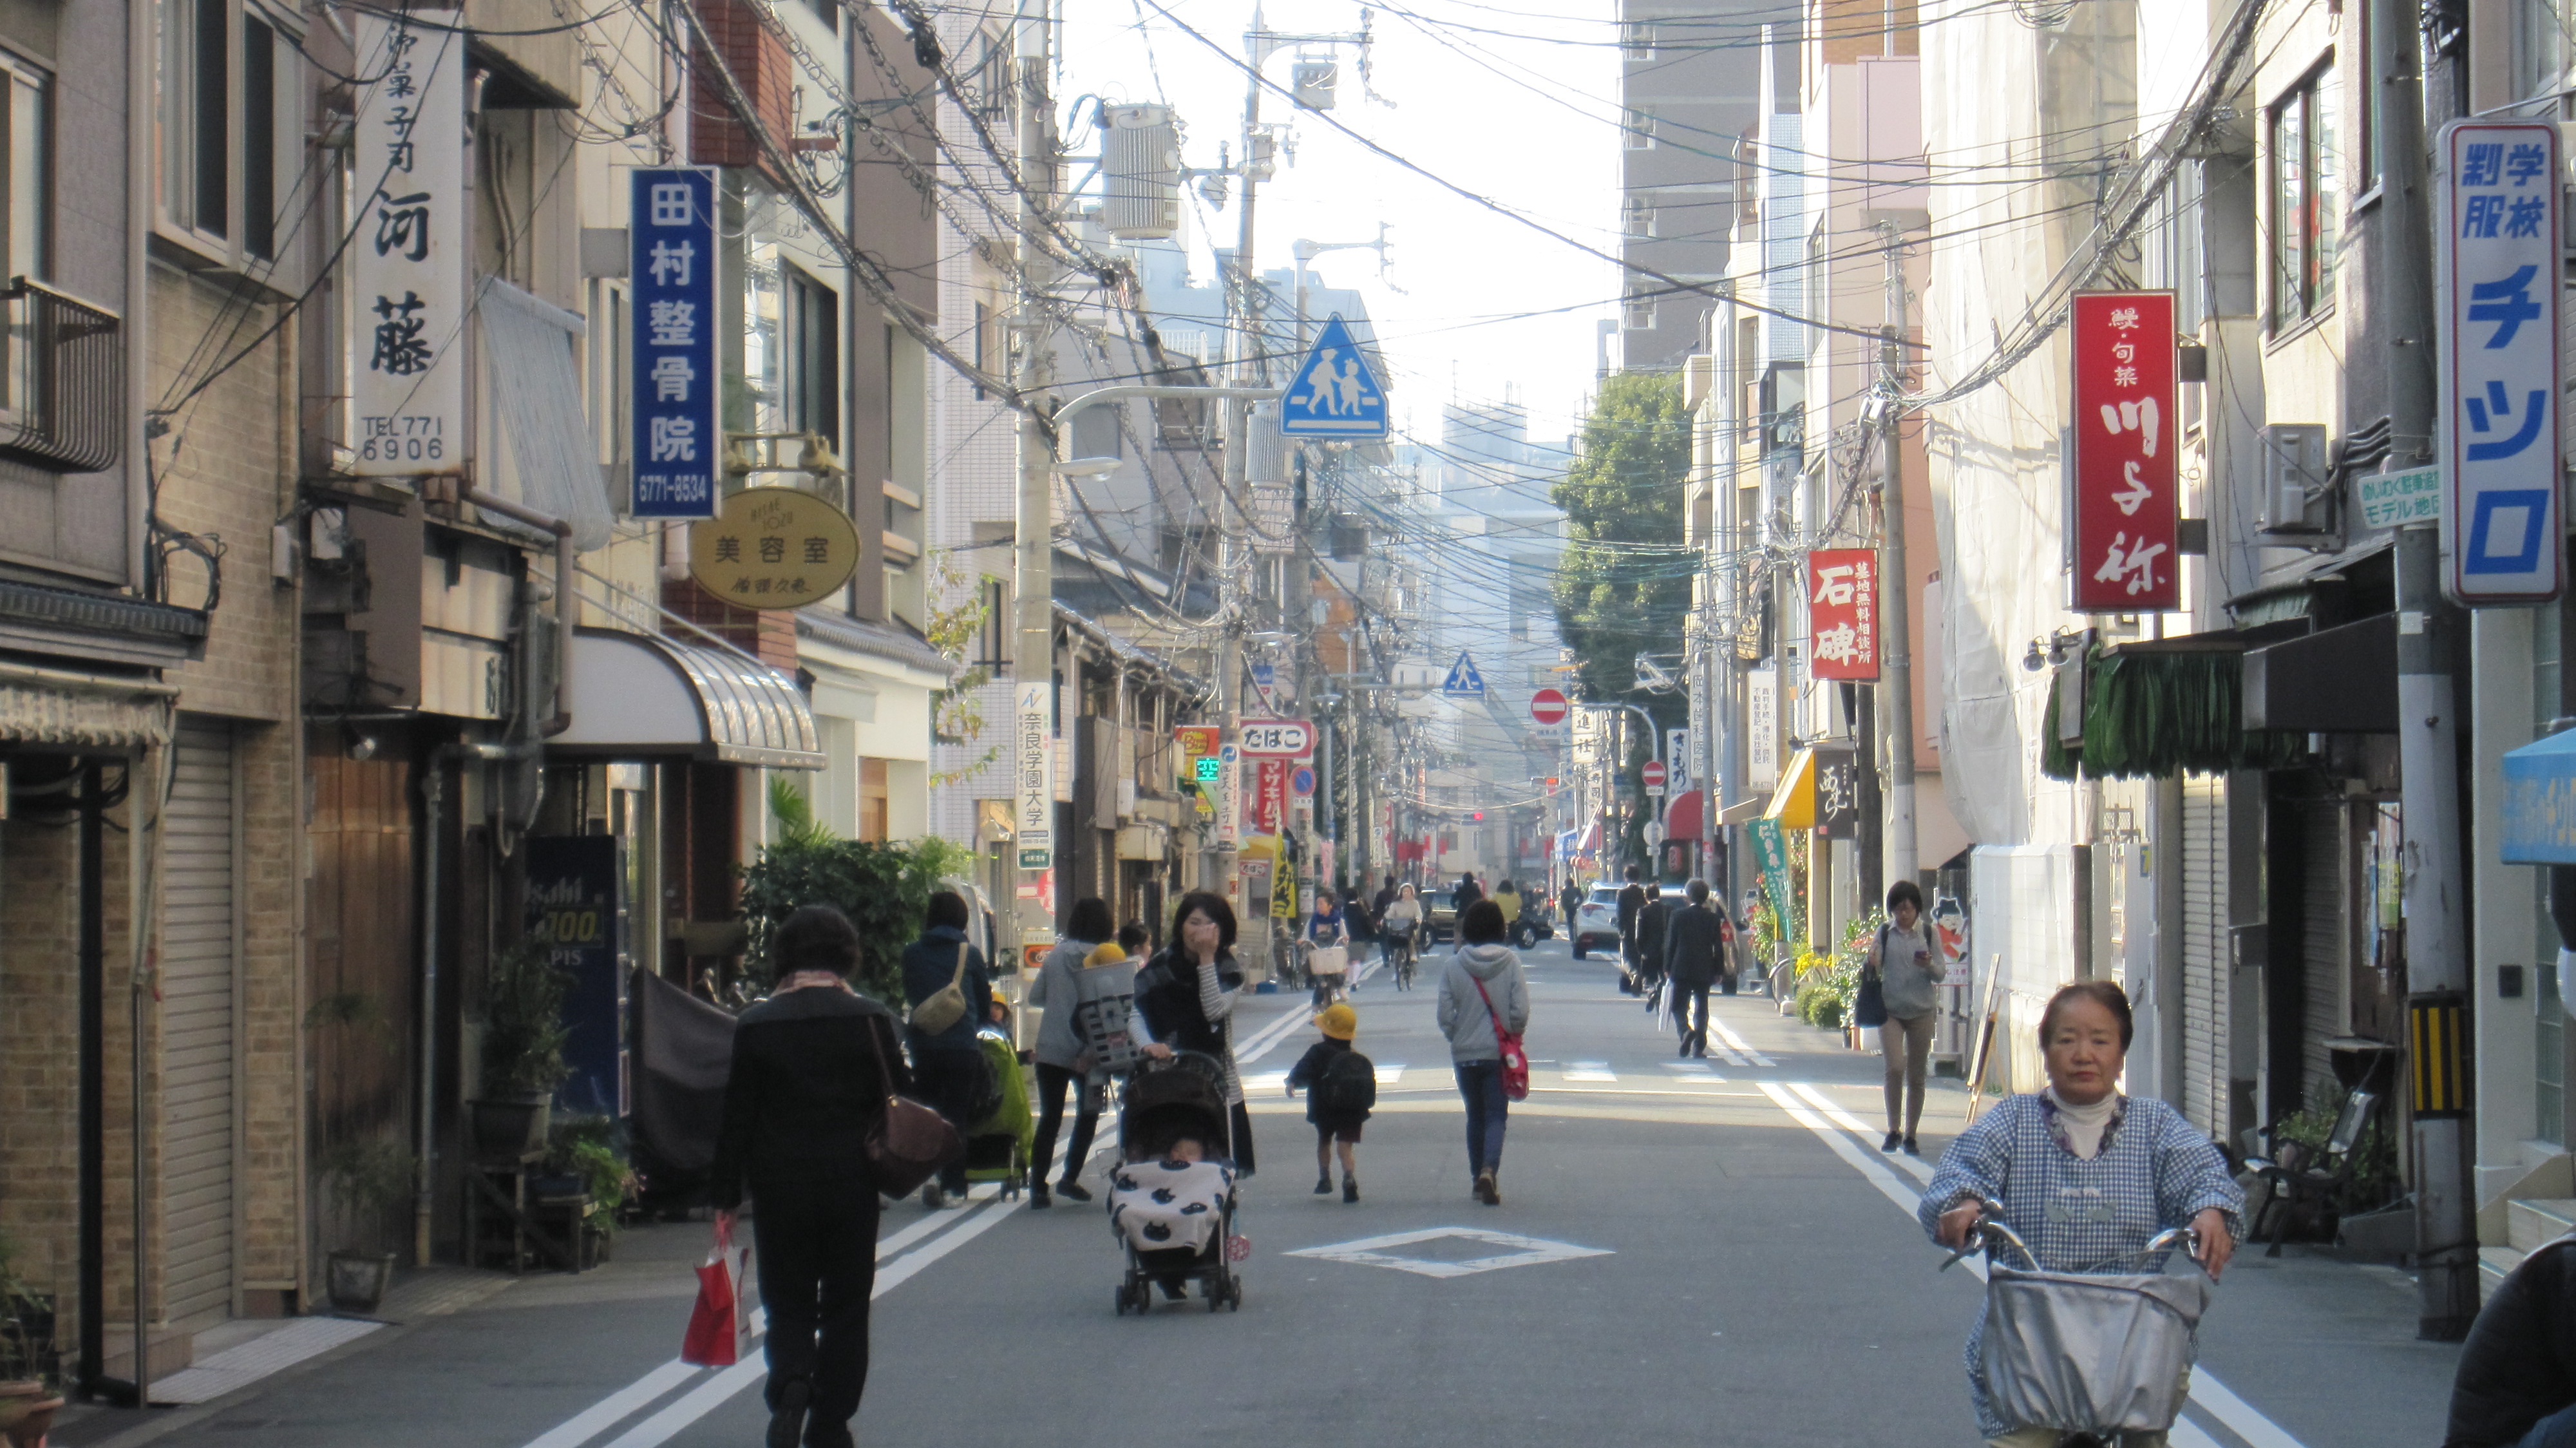
(I was living in Osaka, Japan, the last year, so all pictures from there that i will upload in the course are taken by me). The information-signboards are a very typical view in Japan, and in this picture is a very visible information. Sometimes the information of the boards is more visual than the building itself. Another informations very visual are the electricity lines that go from one place to another: we can see the density and relevance of the electric system, usually hidden in other cities. We also can see the age and kind of population that uses the street in a certain time of day. As invisible information, we could analyze the noise, the flows of people, and some others, but i find more interesting in this country the informations of heat (and humidity) and and those relating to public transport. In Osaka, like in almost all cities from developed countries, the public transport is linked to a general network of information. The citizens can access to this network from their mobile phones and check the public transport schedules (subway and bus). This is essential to avoid being late to work or class. Another very important invisible information is the heat and humidity. Almost all houses have an air conditioning system, and in summer of course they put it on. This system often throws the hot air to the street (as a video lecture of this course says), making the temperature of some streets very high. Doing this information visual could be useful to for acting in those streets making them more pleasant for pedestrians.