Uploaded on 2018-01-02 by Ariela Monteiro de Alvarenga
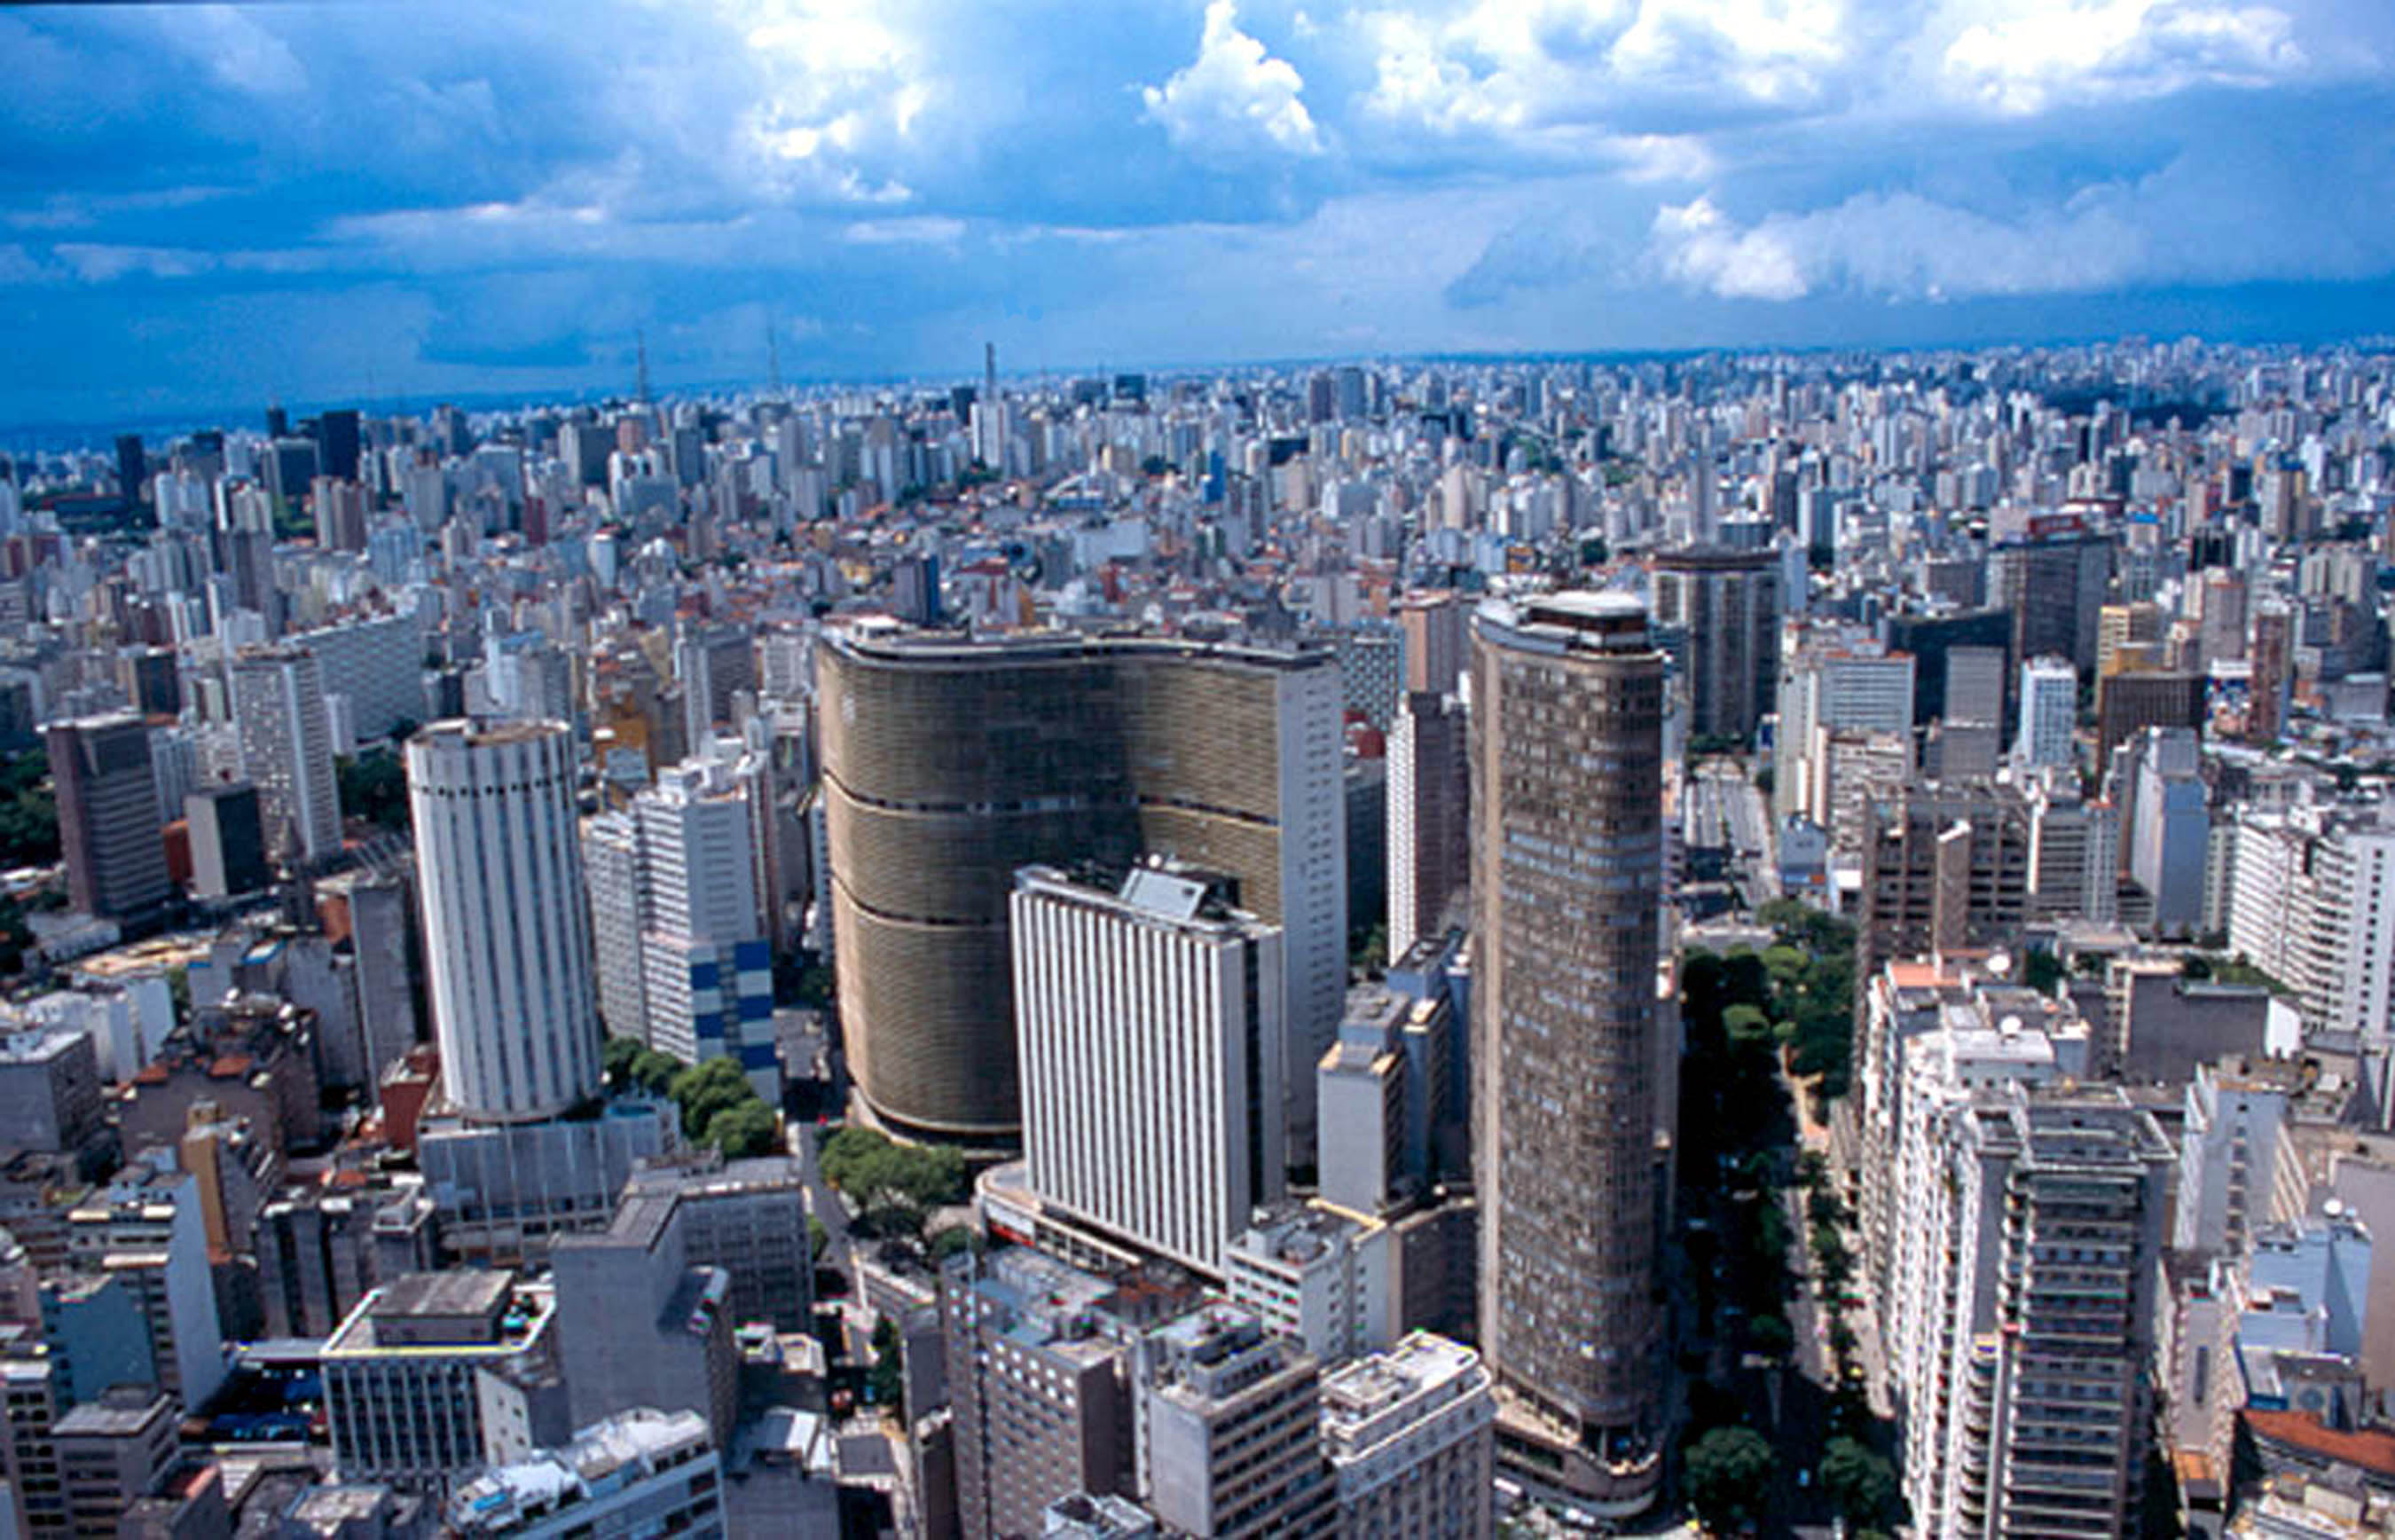
1.ANSWER Philadelphia–Average +3,8º/8 more days above 90ºF each year than rural areas Cincinnati–Average +0,9º/0 more days above 90ºF each year than rural areas Charlotte–Average -1,4º/16 fewer days above 90ºF each year than rural areas 2.ANSWER According to the National Institute of Meteorology (INMET), Sao Paulo City has an online chart since 1995. It is possible to choose the years and verify the temperature, rainfall, wind speed and etc. Please verify the figures above from Sao Paulo City: •Jan/2000 until Dec/2009–highest temperature 31ºC or 87,8ºF/lowest temperature 11ºC or 51,8ºF •June/2010 until May/2017–highest temperature 32ºC or 89,6ºF/lowest temperature 10ºC or 50ºF Verify the figures above from small City (Taubate): •Jan/2000 until Dec/2009–highest temperature 28ºC or 82,4ºF/lowest temperature 12ºC or 53,6ºF •Jan/2010 until Aug/2014-highest temperature 27ºC or 80,6ºF/lowest temperature 13ºC or 55,4ºF(Unfortunately, I did not find any information between 2014 until 2017). http://www.inmet.gov.br/portal/index.php?r=home/page&page=rede_estacoes_conv_graf 3.ANSWER •Restrict the height of buildings; •Stimulate permeable surfaces. 4.ANSWER •Sao Paulo City Aim Program, from 2017 to 2020–It is a program to develop 5 areas in the city: Healthcare, Education, Urban and Environment, Civic and Social Engagement and Public Accounting Practices. •Measure of efficiency heating buildings for civil construction (ABNT); •Environmental company of Sao Paulo State (CETESB).