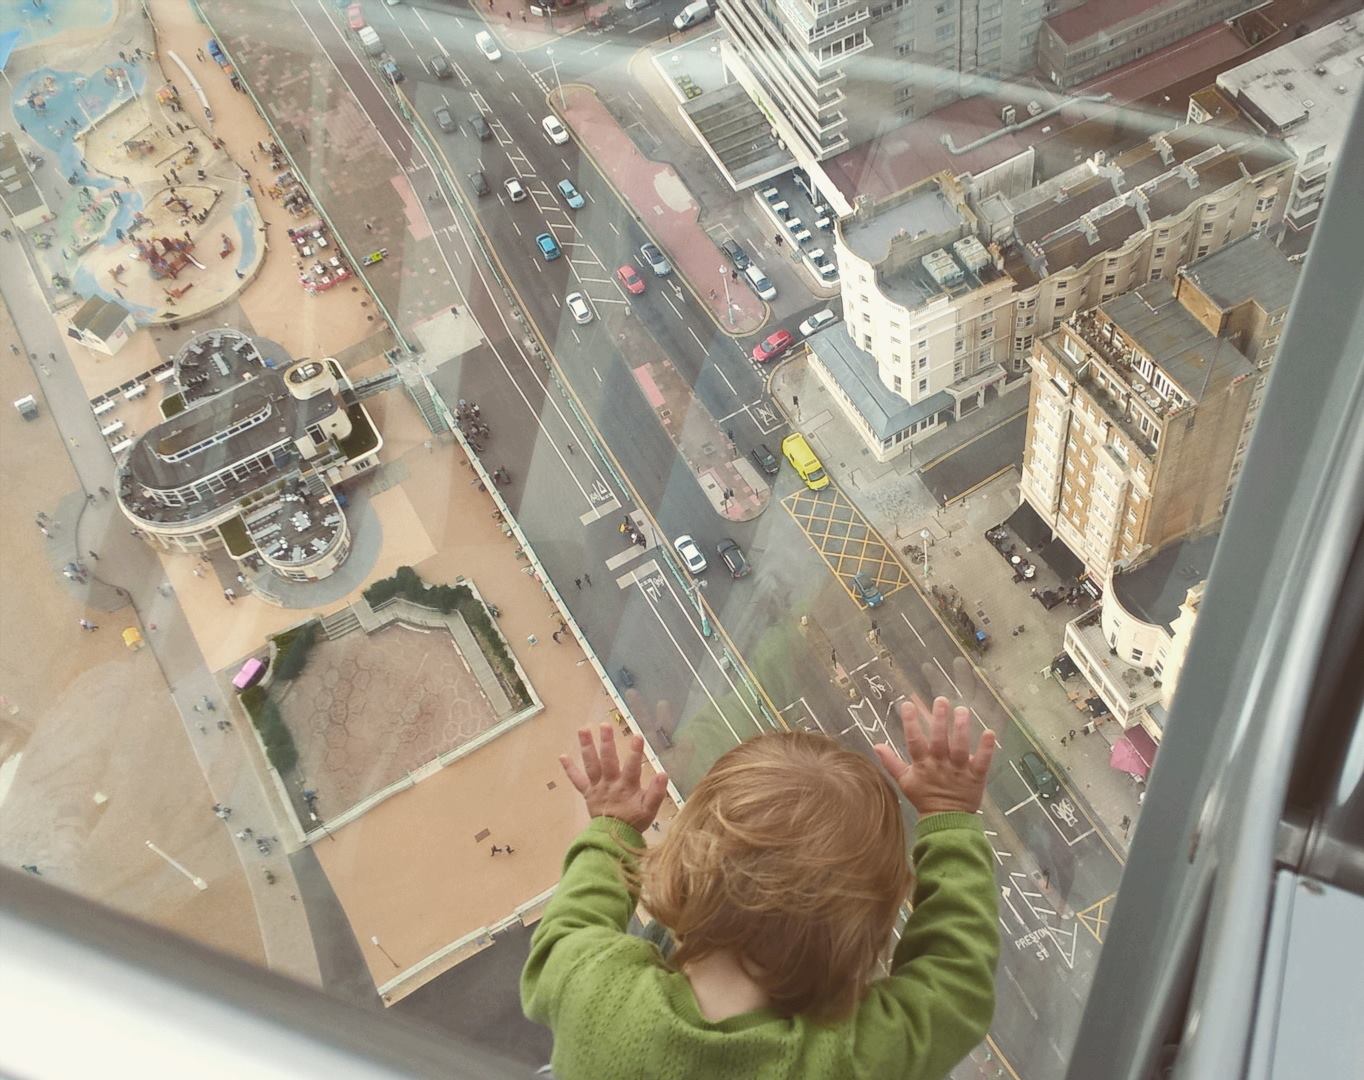
United Kingdom, Brighton
FC-01x Future Cities (Self-Paced) - Exercise 1 : "Making the Invisible - Visible"

Uploaded on 2017-09-21 by Beata Konig
Note: While I currently live in my hometown Budapest, Hungary, I took this photo in Brighton where I lived for over 5 years and really liked it for this exercise. Brighton is also the place where my interest in urbanism and sustainability really started to grow, so I thought fitting to use this image. Question 1. Visible information: - Left lane driving. - The area is used by pedestrians, bikes, cars; but no public transport or large vehicles are visible. - Bicycles were considered by giving them space at the front of the lane at traffic lights, even there are separate bike lanes along the road. - In the image, there is more space for pedestrians than vehicles. - Various recreational areas, such as restaurants, cafes, playground with pool are visible, as well as the viewing tower from where the image was taken. This shows that this is a touristic/recreational area of the city. - Buildings' density is much higher to the right of the image than to the left, and the buildings have a nicer facade towards the clear space. This is where they are meant to be seen from. - The sea is somewhat visible in the bottom left corner, explaining the above point. - The buildings do not have a uniform style, suggesting they were built at different times. - There is barely any greenery in this area, and none that is allowed to grow freely. - Not much parking space is visible. - At the time the photo was taken, the two-lane road was sufficient for the number of vehicles using it. - Roof spaces are barely utilised. Question 2. Two pieces of invisible information: - We could start by surveying and analysing the traffic patterns of vehicles: cars and bikes. How dense is the car traffic? What ratio of cars stay on the main road, and what use the intersections to turn on or off it? How many (if any) cars park in non-designated parking areas, and where exactly? How many people bike in this area? Do they tend to use the road or the bike lanes? Do they come to this area as their destination or travel through? If this is their destination, where do they leave their bikes? How is all the above related to the day of the week or time of the day, or even, the time of the year? - Next we could analyse the behaviour of the pedestrians. How much is this space used? How long does each person spend there on average? Do people visit alone, in pairs, in groups? Which buildings are used the most, what are their functions? Is this area along the seafront easy, straightforward to approach on foot? Do people most often cross the main street at the designated crossings? And again, how does all this change as a function of time? - Both above topics can be researched with traffic and CCTV camera footage, as well as social media data (check-ins, searches etc). Question 3. Suggestion to improve quality of life with knowledge from invisible information Invisible information: Information on car and bicycle parking habits in the area. Knowledge: We could find that during some parts of the day there is not enough available designated parking space, if many cars park on the sidewalk, and bikes are chained to lampposts or railings haphazardly. We know that this can elevate the risk of accidents, make both vehicle and pedestrian traffic less smooth, and can also lead to more bikes being stolen. Possible solution/improvement: We can create adequate parking areas at the places which are used for parking now anyway. We can also combine this with data of which pedestrian areas are the least used, and convert these to parking or bicycle storage for the busiest parts of the day with programmable borders or separators that clearly indicate the changing function of the space.