Uploaded on 2017-03-30 by Patricia Cazorla
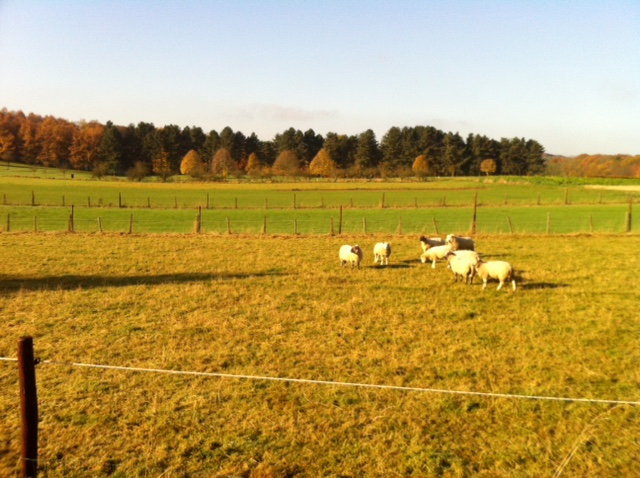
Which are the main UHI effects that you can identify in your area? The urban heat stress for the whole of Flanders and surroundings was mapped by satellite images. Compared with the countryside, the night temperature is higher in cities. This difference amounts, on average, to a few degrees, with peaks of 7 to 8 ° C and more. Flemish cities with a relatively large heat island effect are Antwerp, Ghent, Kortrijk, Mechelen, Roeselare and Bruges. In Antwerp, a significantly higher percentage of the population is exposed to higher temperatures than in other cities. Regarding temperature, it is registered in Belgium an increment of 2.4°C annually with respect to the pre-industrial period. All seasons are becoming warmer (+3°C in spring). During the day, the urban area in Belgium is on average 0.94°C warmer relative to the countryside, with a difference in maximum temperature of 1.47°C. Also, the frequency and the extent of heat waves shows an increase. The number of days with heavy precipitation has increased from 3 to 6 days per year since the early 1950s and the maximum precipitation measured in a consecutive period of 5, 10 or 15 days within a year is increasing too. Since the 1960s the average wind speed inland has decreased: -10 to -15 % over 5 decades. The urban area experiences lower mean relative humidity (−5.04%). Annual average sea level is increasing, for instance in Ostend the long-term trend is 11.5 cm higher than in the early 1950s. The seawater temperature on the Belgian side of the North Sea is increasing at a rate of 0.034 °C/year. The climate scenarios for Flanders indicate an increase in the annual average temperature by 0.7 to 7.2° C over a period of 100 years. The following photos correspond to an urban area in the centrum of Brussels (left), and its surroundings (right). urban BrusselsBrussels surroundings As you can see in the right photo there is a high density of buildings (5-floor story), there is a presence of the private car and the tram, but there is no vegetation at all. While in the left photo, the landscape is dominated by nature. Urbanization not only affect microclimate, but also biology species such as the butterflies. As consequence of the UHI effect, there is a decrease in the probability of the larval survival and adult body resistance. 3. Which are the measures you would propose? I would propose a set of measures to aim the self-sufficiency of the neighborhoods. It includes the use of smarter materials to retain the heat during the winter and to dissipate it during the summer. Also, the use of solar panels to produce the required energy and green roofs to increase the absorption of CO2. Regarding urban planning, I would like to establish a mix of land use to reduce the need for transport and the increase of incentives for electric cars, as well as for public transport, cycling and walking. 4. Is UHI effect concerning policy making in your area? Yes, there are some policies such us MIRA CLIMATE REPORT 2015: ABOUT OBSERVED AND FUTURE CLIMATE CHANGES IN FLANDERS AND BELGIUM in which the Flemish government test some scenarios regarding climate change and UHI. The Agenda for 2030 and 2050 regarding climate change is based on these simulations.