Week 7 - stocks and flows in Groningen
FC-01x Future Cities (1st Run) - Exercise 2: "Stocks and Flows"

Uploaded on 2015-05-21 by Julia_ub
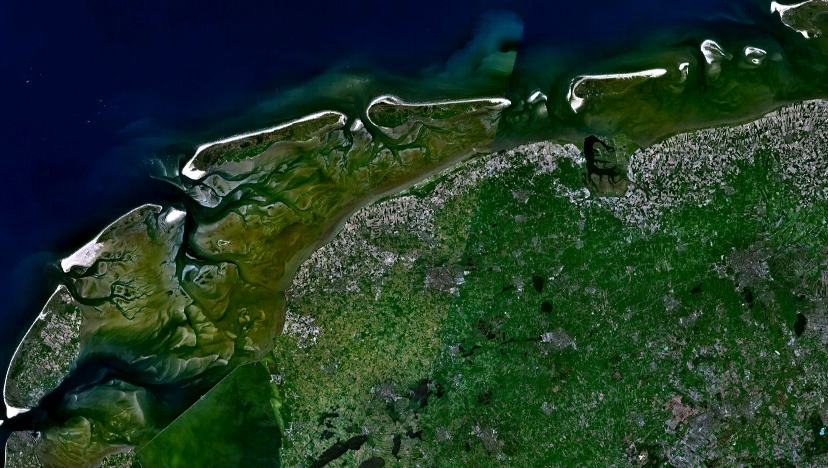
The system imposed in the city of Groningen to collect rubbish is based on a system of buried containers. There are several collecting points along the city. As inhabitant of the city you get a smart card which is associated to only one of these containers (depending on your address) and you need to use it every time you have to have to get rid of the rubbish. The **stock** here is the rubbish itself that is storage in these containers. The **input flow** are the rubbish bags we deposit in the surface device as citizens, moreover, the **outflow** happens every time these containers are emptied by trash trucks (which will leave the stock as 0). Every smart card is unique, thus is easy to know how many times **(frequency)** do you use it. The room available to place your bag is quite limited so only one bag per time can be placed. This way it’s also quite easy to make an **estimation of the volume** of rubbish you produce. *Profit:* Given these facts, we can estimate in which stage of its capacity the container is (how much stock do we have due to the input flow). This sytem is quite profitable, since we can easily adapt and tailor the pick-up frequency of the trash trucks and optimize the collection periods per areas. (i.e. in the center, which is more dense the frequency should be higher than in the suburbs). ![Trash buried container][1] ![Detail smart card reader][2] **2. Land -> Frisian or Wadden Islands** I have included this stock/flow as an example of my analysis as I find it curious and offers something different. Even though before starting this module I didn’t expect that land could be considered as stock/flow. Groningen (north of The Netherlands) is quite close (30 km) to the line coast (Wadden sea). The Frisian Islands run parallel to this coast line. They constitute the separation barrier between the wadden sea ((large parts of which fall dry during low tide) and the northern sea. 7000 years ago the sea level arose up to the current coast line and due to tidal forces, **large quantities of sand (stock) formed a line of dunes (flow)** in front of the coast. **Erosion processes** have been modelling and changing the shape and height of these islands. Thus a **flow of sand have always existed since then**. In the southern face the water surge piled up sediment and in the northern face (northern sea) sediment was carried away by the breaking waves. Some shoals have appeared which are covered by infrequent storm floods. The Wadden Islands are in **continuous movement**. They migrate: the islands themselves are slowly but certainly moving from West to East. On the West side most of the islands disappear slowly into the sea and on the East side even larger sand-banks arise. **Human intervention** has also been involved in keeping this natural barrier as it also contributes to the **defense of Dutch coast line**. They control the shape of the islands and their height in order to calculate the volume that flows between the period study and in order to keep that stock as stable as possible. *Profit* Benefits of these stock/flow analysis are obvious as it helps to monitorize the movement of sand. Predict the evolution of this movement (and take advantage of it) will help to prevent posisble risks such as floods of the coast line. ![Wadden islands in front of Dutch coast line][3] ![Satellite view Wadden islands][4] **3. Students density** The third and last stock/flow I propose is the density of students in the city. **Groningen is a typical university city** where most of its population are students who rent and live in flats spread along the city. It is not quite common to live in dorms thus the common way of living is sharing the appartment with 2 or 3 more people (otherwise is extremely expensive to be affordable for a student). As we have seen, makes sense to make a density study over the years, to get a better insight of the evolution of the city, **however, in this case I propose a seasonal study** to obtain how the density of the city (analyzed by neighbourhoods) changes. The **stock itself are the students** living in the city, thus the dataset used to get this info can be the **rental apartment contracts**. Flow is how many of those contracts ends (or change its householder) at the end of an specific period ( month, quarter, semester, year), this way we can stablish which parts of the city are more empty during an specific period (summer for instance). *Profit* This will reveal where students prefer living. It can result that students prefer living either in the suburbs (near the campus) or in the center (it can be cheaper as families with children prefer more space and bigger houses). In long term we could compared this density study trough the years and see if the trend is still the same as it is nowadays. [1]: https://edxuploads.s3.amazonaws.com/1432200670744769.png [2]: https://edxuploads.s3.amazonaws.com/14322005474142137.png [3]: https://edxuploads.s3.amazonaws.com/14322006983461701.png [4]: https://edxuploads.s3.amazonaws.com/14322006045538285.png