Dublin - Ireland (Visible/Invisible)
FC-01x Future Cities (1st Run) - Exercise 1 : "Making the Invisible - Visible"

Uploaded on 2014-11-15 by biancanasser
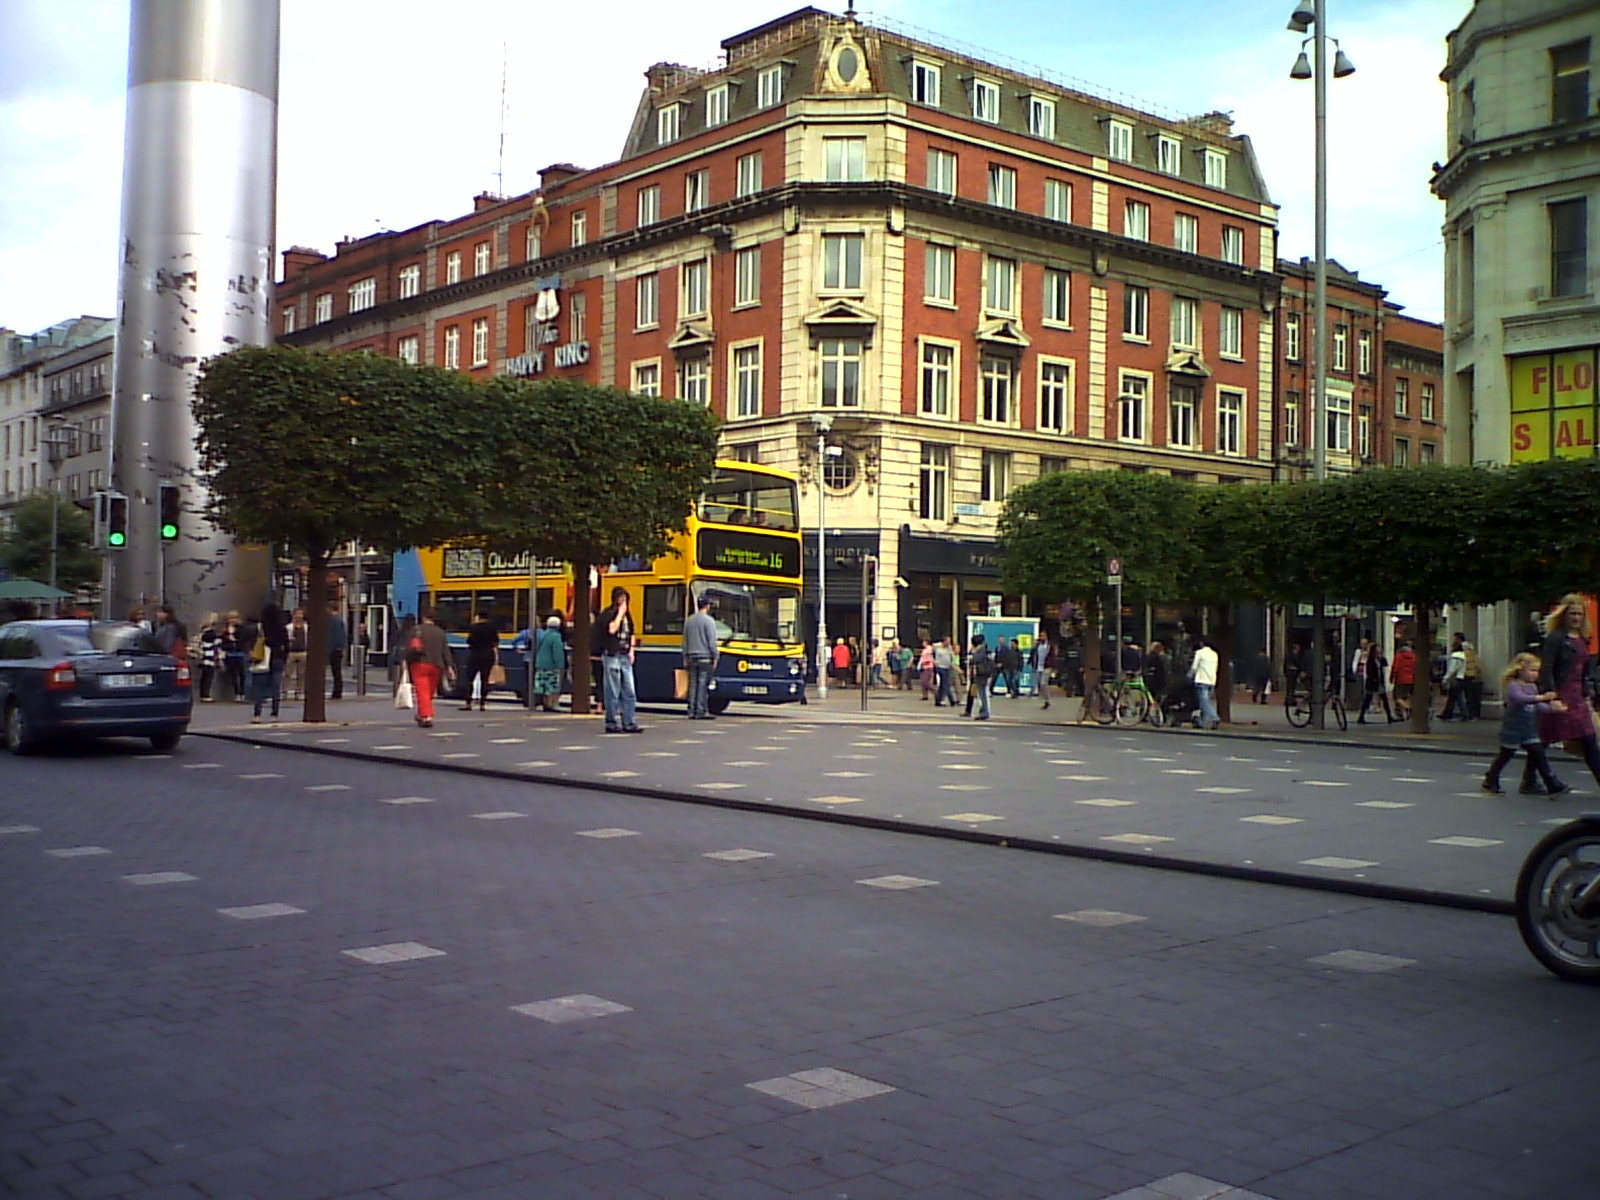
[1]: https://edxuploads.s3.amazonaws.com/14160802119558228.jpg In the picture, it is possible to observe the city centre of Dublin (Ireland). At first analysis, we can see the traffic (bus, cars, bycicles and people). This is a visible information (flow of data). We can also see buildings, monuments (big spike), eletricity poles, among other information. From the visible information, we can abstract invisible information as well. The first would be the analysis of transportation of people in the city. Identifying the places with big flow of people, streets with high number oh vehicles in a day, could give information and data and from this, develop a better public transport. The second one would be the analysis of activities and flow of people in order to understand the most attractives areas of the city. From this analysis, urban planners would be able to have and a clue for public administration and understand the main needs of the city. The public transport analysis, is very useful especially in big cities. Once we know where are the problems, we can organize a solution for them. Creating more bus routes, extending the length of some streets, creating bus corridors or even developing another types of public transport. These are just some works based on the analysis of visible and invisible information. Urban planning is a key work in the development of a city good for everybody to live.