Uploaded on 2014-12-01 by harrylee17
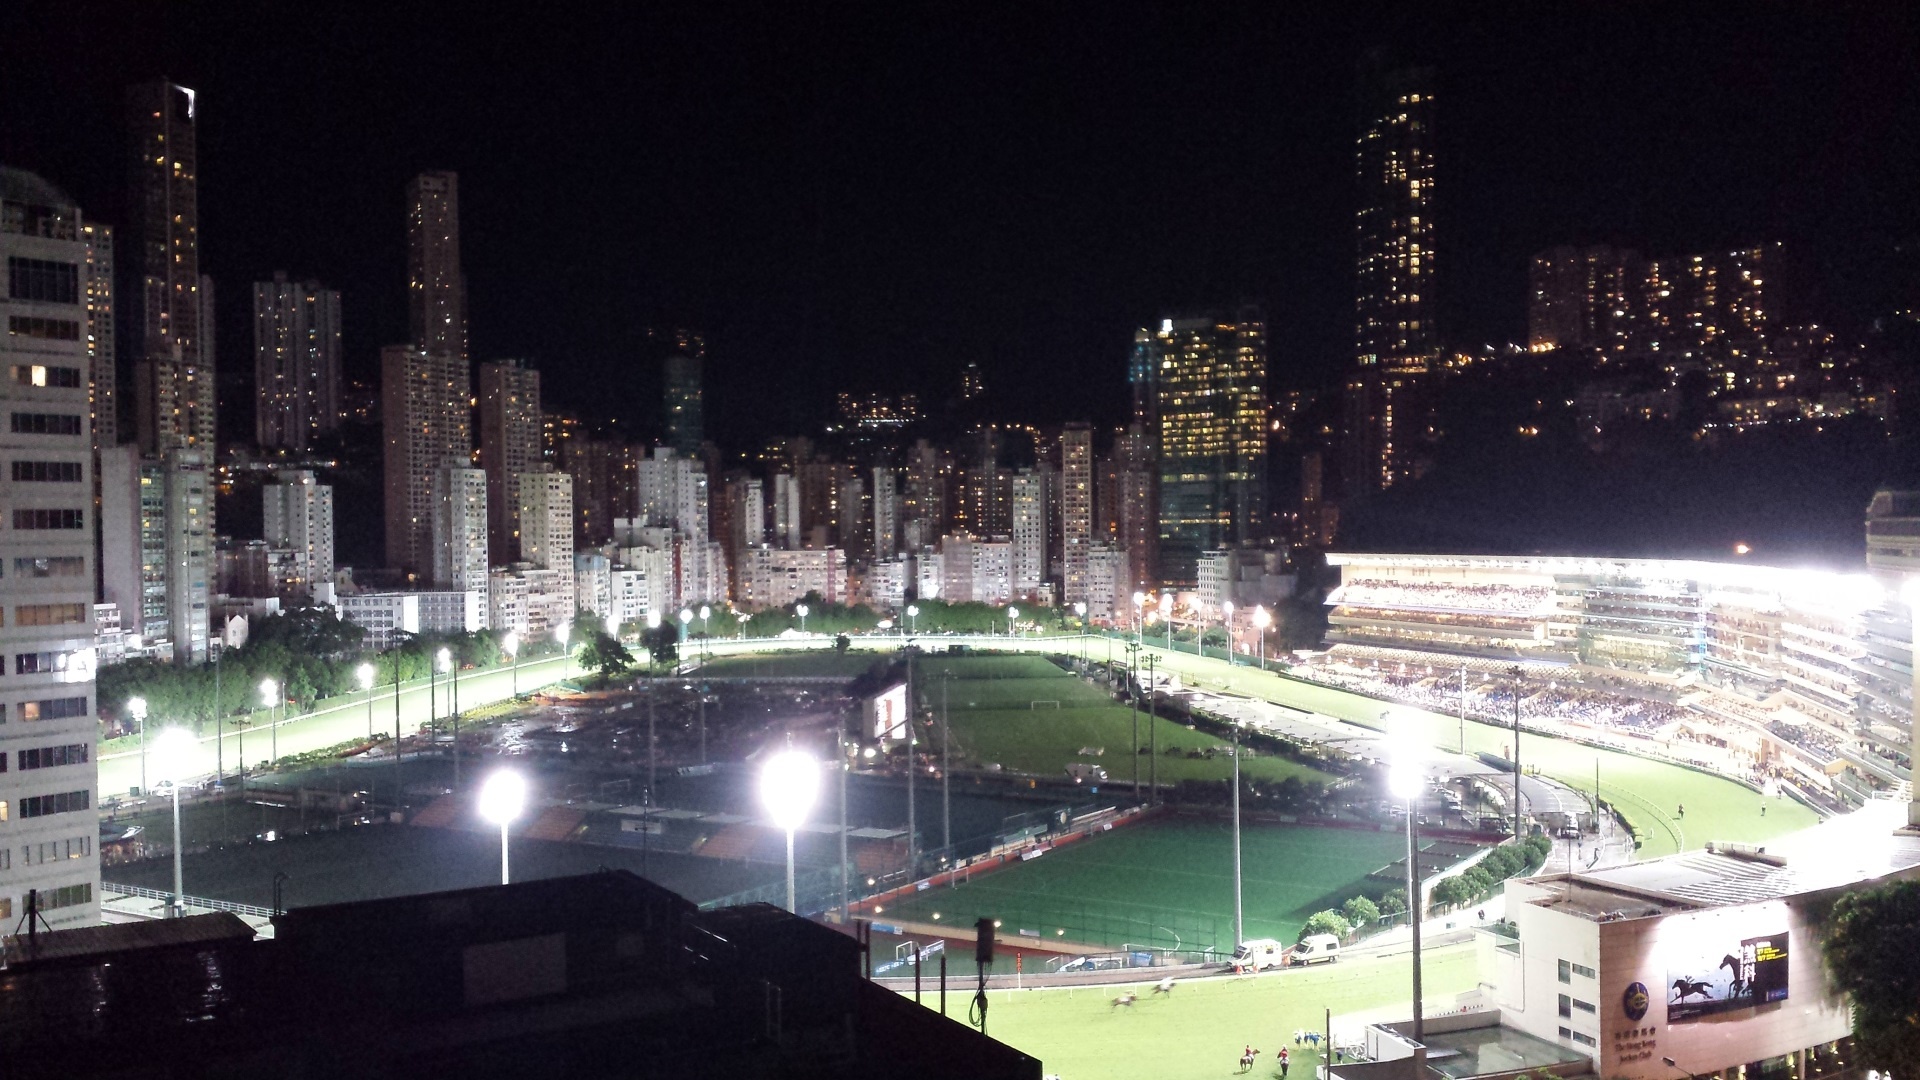
1) Visible information - spectator (% occupancy), buildings, lighting used 2) Two "invisible information" - (i) volume of bets to each horse-racing, (ii) mode of transportation for spectators to/from race course 3) from analysing the mode of transportation, we can understand the utilisation of roads, public transport efficiency, road linkage & bottleneck(s), and time needed to (and improvement on) crowd management. ![Happy Valley, Hong Kong][1] [1]: https://edxuploads.s3.amazonaws.com/14174310845212338.jpg