Uploaded on 2014-12-09 by Xenia_arch
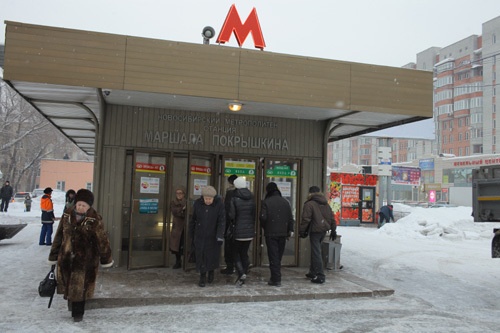
*Photo is not mine - technical reasons with the platform. Example shows an Underground station entrance in Novosibirsk, Russia. It is obvious to see here where is entrance and where is exit, what infrastructure is around the place, how and where people move, to see the scale. It is impossible to see from here how often these people pass this way, whether they just enter this station and won't be back or opposite, not obvious how often they use this public transport and how many time they spend inside waiting or going by train, not obvious whether this people change stations and/or reconnect to other public transport. There are cards and coins to use in Novosibirsk subway, but this helps just to calculate total amount of entering passengers per day, no monitoring of leaving people on each station or of how many stations they passed is set, that means invisible data won't give full knowledge to use here. In the case of full information some corrections could be made. The simplest one is to widen the entrance pavilion on that stations which are overcrowded and doesn't allow to keep calm flow (Karl-Marx Station where people have to wait behind the doors and form lines and crowds), another result - quantity of trains and timing (Siberian Station, where the crowd appears in a minute after the last train leaving and waits for 7 min for the next train), etc. Knowing transport junctions and connections in demand it could be possible to renovate public transport system and infrastructure in aim to make the whole city system more convenient for citizens. When the city works as the unique organism and socially oriented, urban structure is stable and well-developed, citizens are satisfied. [1]: http://img1.sibnovosti.ru/pictures/0465/0177/na_stantsii_metro_marshala_pokryshkna_v_novosibirske_poyavitsya_samolet_thumb_fed_photo.jpg