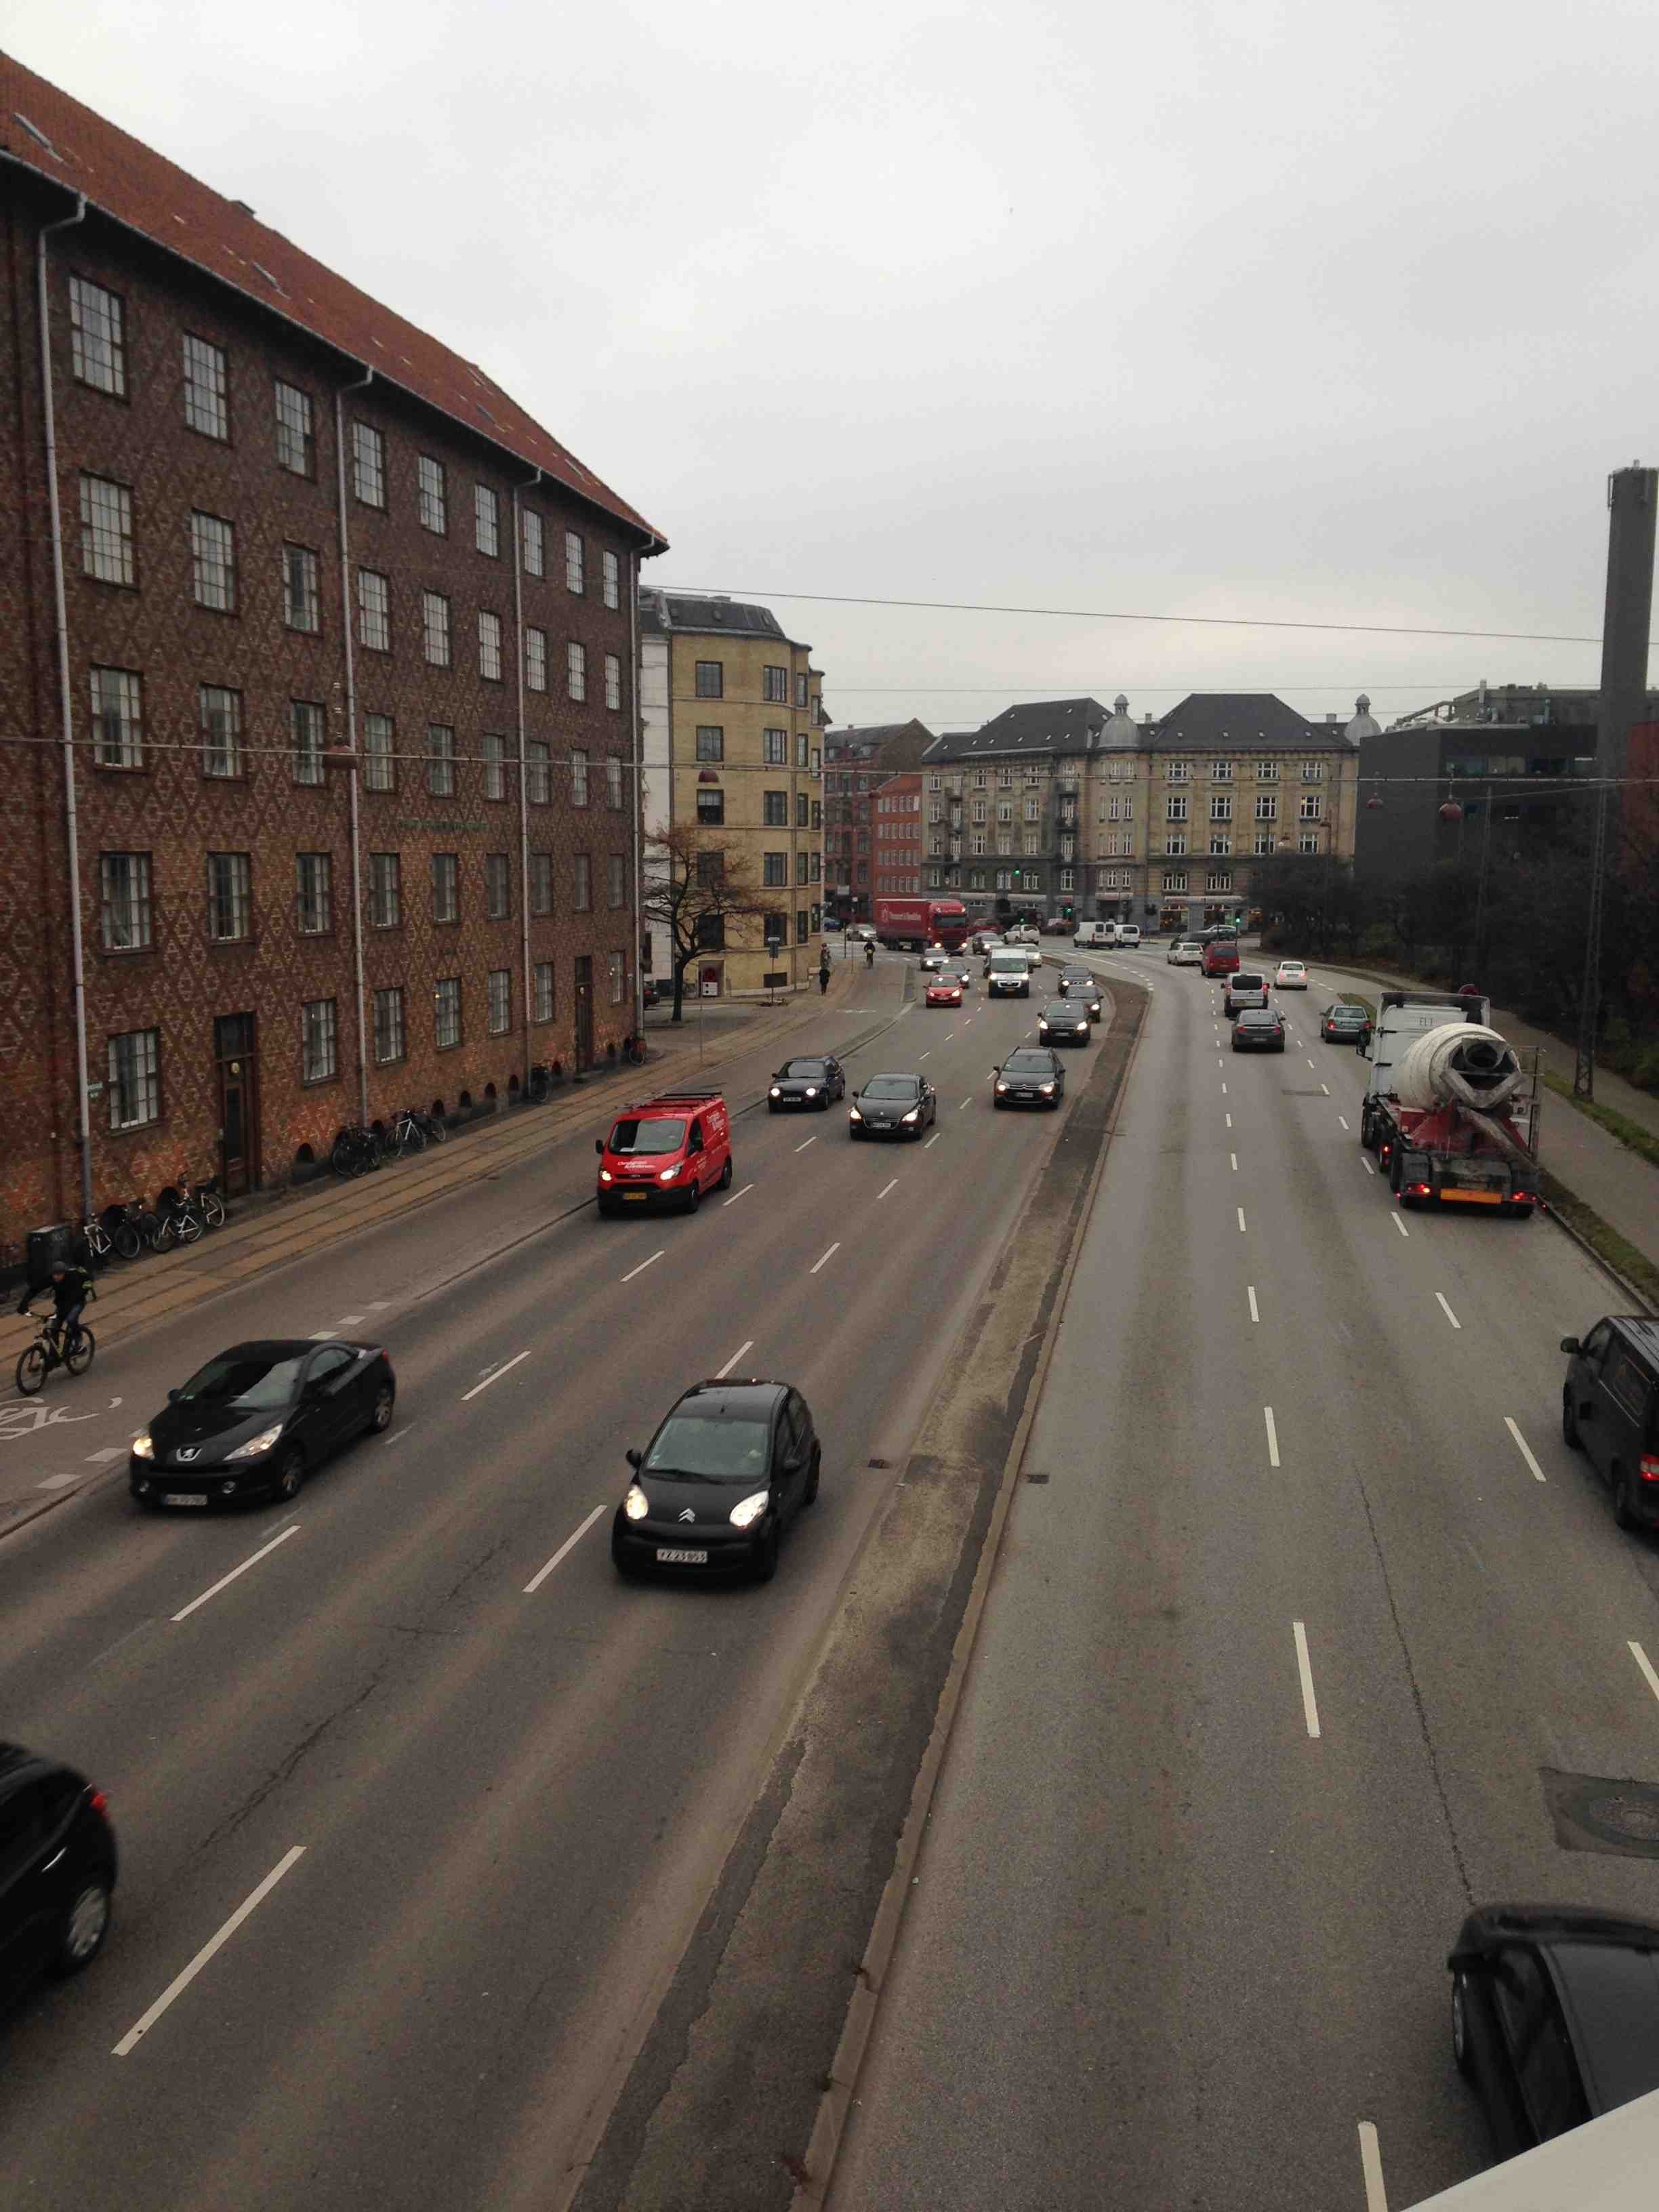
Traffic, flooding and big data in Copenhagen
FC-01x Future Cities (1st Run) - Exercise 1 : "Making the Invisible - Visible"

Uploaded on 2014-12-04 by AlanKadduri
How will I use big data? The case of Copenhagen Despite being labelled as a sustainable, green and progressive city, Copenhagen has its infrastructural challenges. Traffic is a major issue, and central Copenhagen as well as the surrounding highways, are constantly congested when commuters are moving from home to work. Above all, the most urgent problem of today is flooding. Copenhagen is increasingly receiving heavy rain and cloudbursts, with the case of 2011 and 2014 being the most destructive. The city centre and the old boroughs on inner Copenhagen are the most vulnerable. Åboulevarden (a main highway running through inner Copenhagen) is one of the areas with most trouble handling sudden increase of water. At the same time it is one of the most congested highways of the capital. The picture is taken around noon where traffic is very light. The solution There are several proposals on how to solve the issue of flooding. I believe that by using landscape architecture, the capital can once again be protected against flooding. Linking this to the challenge of increased traffic congestion, the solution could be to transform Åboulevarden into a water stream. To design a green and landscape oriented solution, we will not only direct the traffic away from city center, but also create more green space for the communities and establish a better and more efficient draining system. The idea is to transform the road into an underground tunnel, while bringing the old Ladegårds stream back to the surface and directed it towards the nearby Peblinge Lake. Today, the stream runs in underground pipes along the Åboulevarden highway. A good source of inspiration would be the Smart - Stormwater Management and Road Tunnel, which has been used in Malaysia's capital Kuala Lumpur, since 2007. Identifying Big Data Visible data: Number of vehicles using the road on a daily basis. Road signals. Traffic on bike lanes. Pedestrian behaviour. Communities living around the highway Invisible data: Patterns of traffic behaviour. Understanding where the traffic comes from Interchange patterns: Analyse the data to understand the impact of a new tunnel. Analyse the data to make reasonable forecast of the traffic flow. Analyse the signal system so congestion in the tunnel can be avoided [1]: https://edxuploads.s3.amazonaws.com/14176992724436772.jpg