Uploaded on 2016-05-02 by AlessandraWeiss
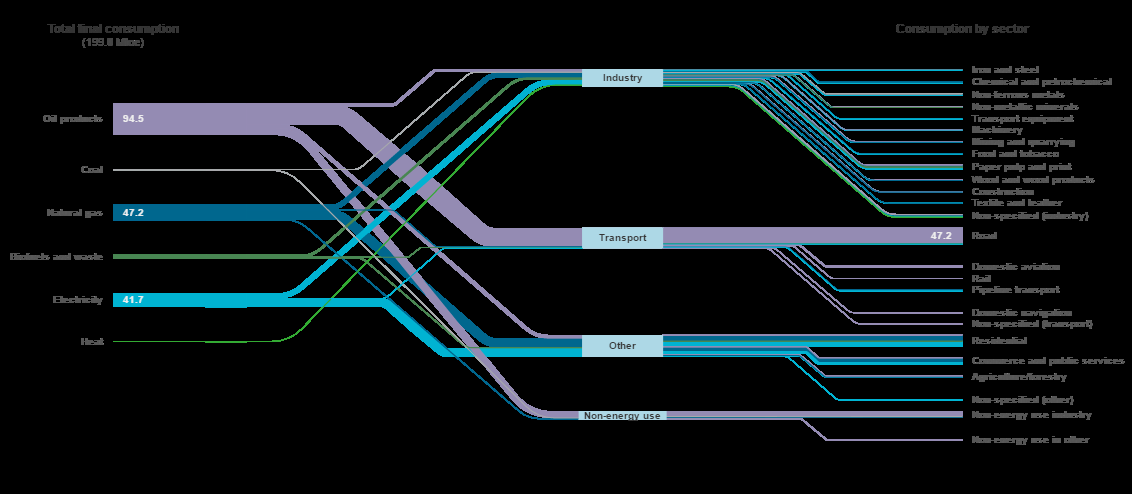
![Sankey Diagram-CANADA][1] Sankey Diagram for Canada- Total final consumption-(2013) IEA Sankey Diagram. (n.d.). Retrieved April 10, 2016, from http://www.iea.org/sankey/#?c=Canada The dominant fossil fuels used within Canada according to the Sankey report in 2013 were: 1-Oil products-94.5Mtoe -56.1 Mtoe for Transport- and represents 92% of the total consumed for transport, the majority of this is allocated to the Road sector (47.2Mtoe) where here it represents 96% of the total consumed. -20.1 Mtoe for Non-energy use Industry- and represents 83% of the total consumed for this category. 2-Natural Gas -47.2Mtoe -26.1 Mtoe for Other -and represents 40% of the total consumed, the majority of this is allocated to the Residential sector (14.7Mtoe) where it represents 43% of the total consumed. -14.6Mtoe for Industry- and represents 31% of the total consumed, distributed throughout numerous industries. **NEW POLICY FOR ENERGY** If I were to create a new policy in order to improve the environmentally friendly and sustainable sources and consumption of energy in my country, I would: 1-Provide strong incentives to encourage renewable energy production and consumption over non-renewable sources. 2-Use various forms of energy best available in each region -Solar, wind, tidal...(possibly even from waste? ) 3-Educate the public, young and old about the various forms of energy, the benefits of renewable energy and consumption reduction. 4-Use this educational information to make our neighborhoods and urban environments more attractive to learn and experience by foot or bike. [1]: https://edxuploads.s3.amazonaws.com/14621657604974602.png