Uploaded on 2016-03-06 by KarlaRM
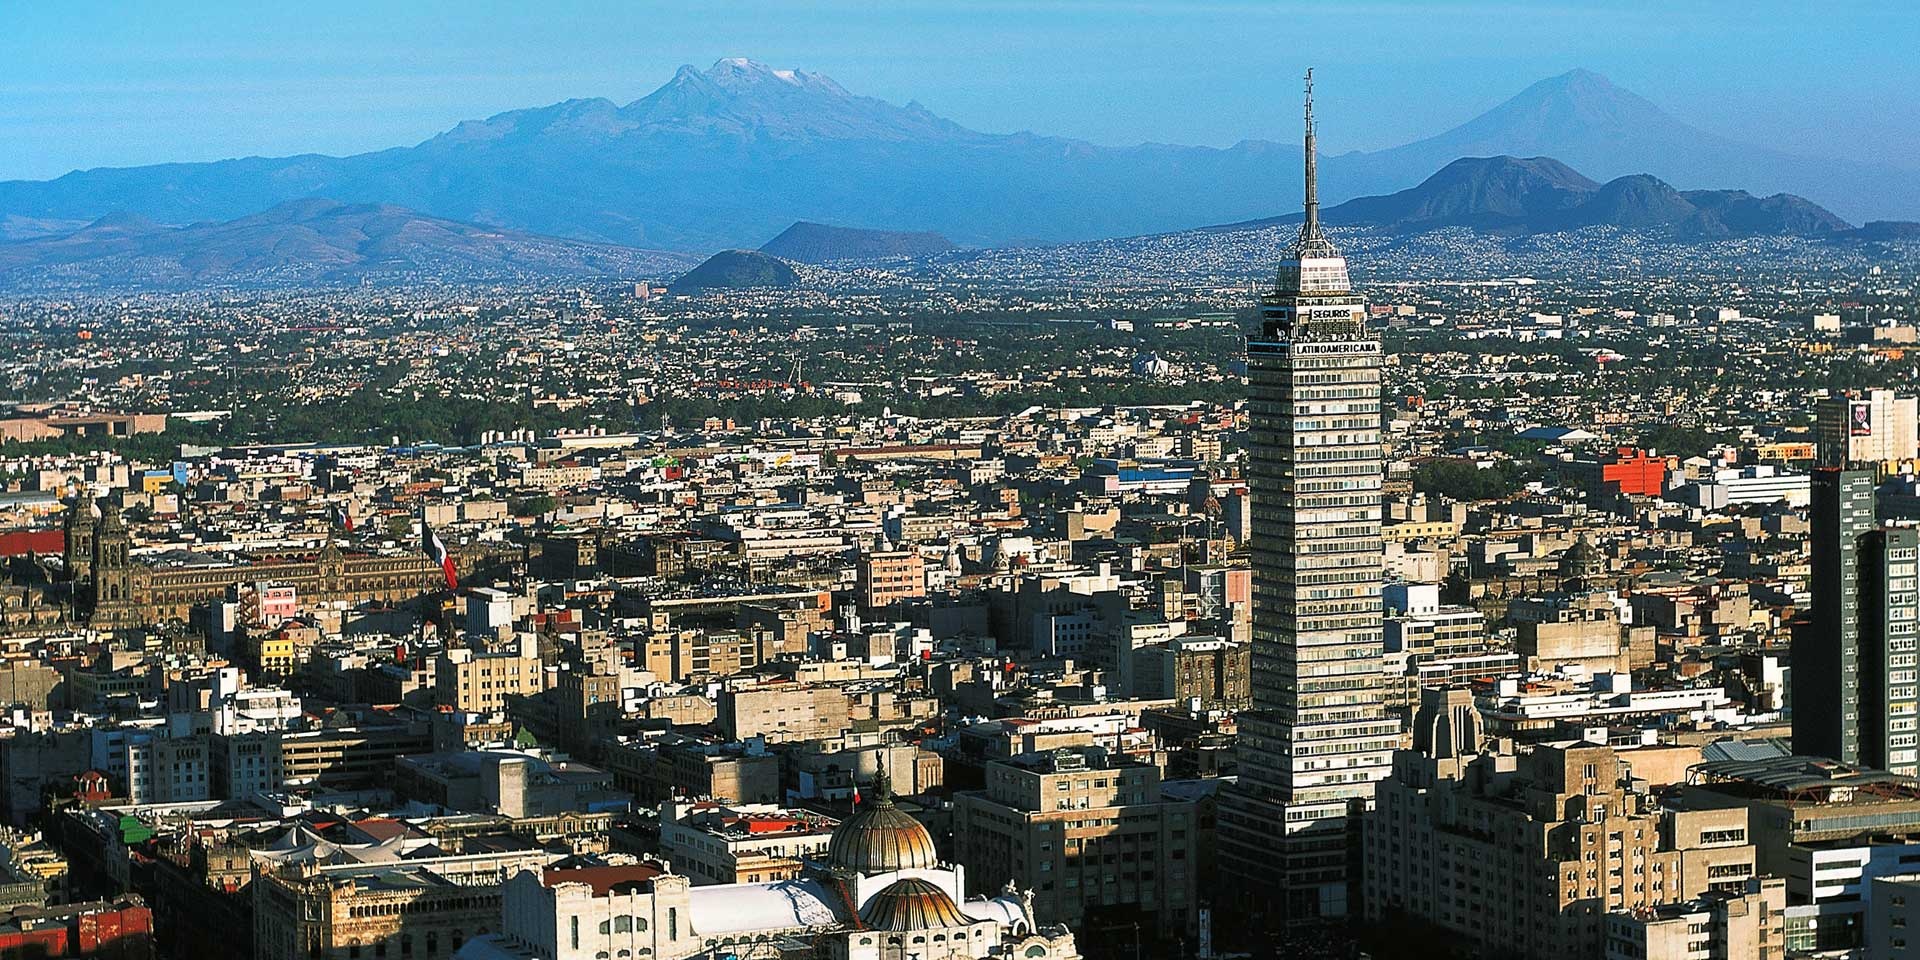
The following map shows the two images. The first one is the average temperature for the different states in Mexico. The second image is about the temperature anomaly, that is the change in temperature of the area. As we can see we have red spots that correlate to the cities. ![][1] The next graph shows the difference in temperature between Mexico City and my town. You can see that the difference is about 1-2 Cº, not much but clearly there. ![][2] We can see that the UHI effects are stronger in the city (first image) because there are many buildings and not as many green areas as in the town (second image). ![][3] ![][4] *II. Which are the measures you would propose?* 1. Better transportation systems. So people use less their cars, more eco-friendly buses, a better subway system, safer cyclist roadways, and promote the use of hybrid or electric cars. 2. More green areas. So the heat can radiate better. And the temperature can be regulated as it would otherwise do in natural environments. 3. Less consumption of energy. If we consume less energy then we pollute less. *III. Is UHI effect concerning policy making in your area?* Unfortunately, I haven't heard any policies concerning the UHI effects. [1]: https://edxuploads.s3.amazonaws.com/14572328147346612.png [2]: https://edxuploads.s3.amazonaws.com/1457233305529402.png [3]: http://www.whitecase.com/sites/whitecase/files/images/locations/MexicoCity_Mexico_Tablet_1920x960.jpg [4]: https://jarginmobiliaria.files.wordpress.com/2012/04/vilaterra81.jpg