Week 4 - Heat island effect (Washington, D.C.)
FC-02x Livable Future Cities ( 2nd Run) - Compulsory Exercise 2

Uploaded on 2016-03-07 by poeticphoebe
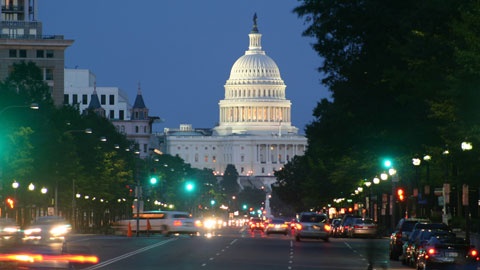
![Washington, city center][1] Figure 4 in Climate Central’s report illustrates example of Washington, D.C. of the temperature dependence of ozone concentration from the city. This plot shows that as urban temperatures in Washington, D.C. increase, ground-level ozone concentrations also tend to increase (statistically significant linear correlation). Furthermore, the highest ozone levels typically occur among the hottest days of the year. ![Washington, D.C. temperature difference][2] If I could take part in the decision making process of an initiative related to the UHI effect, I would propose measures such as reduction of car usage, building more sustainable and environmentally friendly infrastructure (e.g. increasing bike lanes), effective use of space (e.g. narrower distance between buildings and narrower streets) in the process of construction. ![Washington, D.C. suburbs (very generic due to the American urban sprawl)][3] On March 15, 2012, the District of Columbia (DC) hit a record high temperature of 82 °F, compared to the normal daily maximum temperature of 56 °F. The average temperature in DC in March that same year was 10 degrees warmer than historical averages for the month. This becomes one of the most alarming signals for local communities to take action. Some efforts focused on the physical urban environment such as planting more trees, constructing more cool and green roofs, and reducing impervious surfaces. [1]: https://edxuploads.s3.amazonaws.com/1457391738473587.jpg [2]: https://edxuploads.s3.amazonaws.com/14573917924773696.png [3]: https://edxuploads.s3.amazonaws.com/14573919217941352.jpg