Uploaded on 2015-12-06 by CrisArch
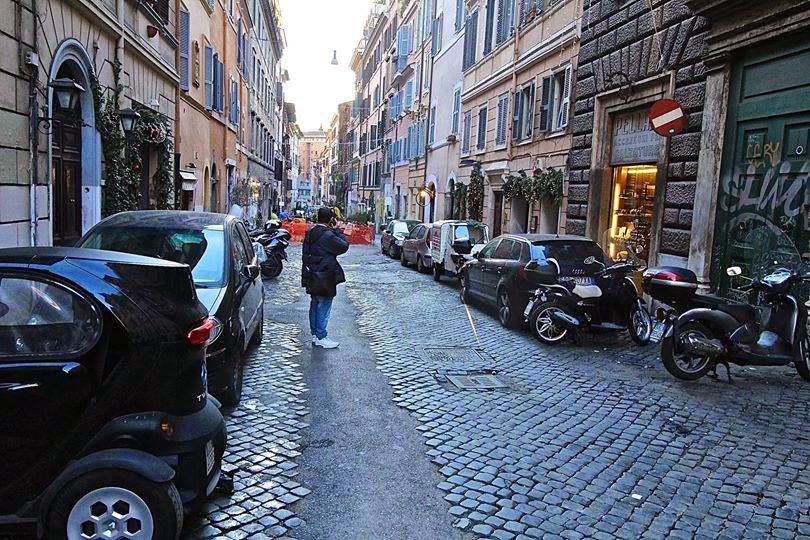
Source: http://journals.plos.org/plosone/article?id=10.1371/journal.pone.0127277 This research is about city area and the surroundings (not only peripheral city zones but also the small town and land around Rome). This explains, in part, the very big difference from very high to very low data (more than 10 °C in daytime). ![During the day, at 14.00 local time, we see a difference of 4-5°C between the city center (Arenula) and the peripheral urban areas.][2] During the day, at 14.00 local time, we see a difference of 4-5°C between the city center (Arenula) and the peripheral urban areas. Source: http://www.researchgate.net/publication/265550479_Which_climate_for_each_urban_context_A_preliminary_comparative_study_on_urban_climate_prediction_and_measurement_in_different_districts_in_Rome_and_Barcelona Let's try a homemade small data collection from: http://www.wunderground.com Roma, Center (via Urbana) ![(via Urbana)][3] 06/12/2015 T Min Max 8-15.5 °C 15/07/2015 T Min Max 4.7-34 °C North-East suburb, Via S. Alessandro ![Via S. Alessandro][4] 06/12/2015 T Min Max 2.7-15.3 °C 15/07/2015 T Min Max 23.2-44.9 °C (I've chosen july the 15th, because it was a very hot day!!!) Via Tiberina, Rome's land area https://www.google.it/maps/@42.0530526,12.5209856,3a,75y,306h,90t/data=!3m7!1e1!3m5!1sH3BoKxfM6XgdDbQGSLXUoQ!2e0!6s%2F%2Fgeo1.ggpht.com%2Fcbk%3Fpanoid%3DH3BoKxfM6XgdDbQGSLXUoQ%26output%3Dthumbnail%26cb_client%3Dmaps_sv.tactile.gps%26thumb%3D2%26w%3D203%26h%3D100%26yaw%3D306.26761%26pitch%3D0!7i13312!8i6656 06/12/2015 T Min Max 2.8-15.6 °C 15/07/2015 T Min Max 23.5-44.4 °C Rome, Center (via di San Marcello) https://www.google.it/maps/place/Via+di+S.+Marcello,+00187+Roma/@41.8984403,12.482678,3a,75y,194.37h,89.32t/data=!3m7!1e1!3m5!1sMZugjf_wod_R-bBfOS_mNQ!2e0!6s%2F%2Fgeo1.ggpht.com%2Fcbk%3Fpanoid%3DMZugjf_wod_R-bBfOS_mNQ%26output%3Dthumbnail%26cb_client%3Dmaps_sv.tactile.gps%26thumb%3D2%26w%3D203%26h%3D100%26yaw%3D299.7294%26pitch%3D0!7i13312!8i6656!4m7!1m4!3m3!1s0x132f605297eee135:0x25009190aa4c0a6!2sVia+di+S.+Marcello,+00187+Roma!3b1!3m1!1s0x132f605297eee135:0x25009190aa4c0a6 06/12/2015 T Min Max 6,4-14.4 °C 15/07/2015 T Min Max 20.3-33.1 °C So, concluding, my homemade research seems to discover that summer max temperatures are almost 10 °C less in the old city centre than in peripheral areas and even than in land areas. I can't explain that. Probably it could be because temperatures are recorded in old narrow streets and, in summer, they're shaded. Surely it could also be because of materials used for street floors and for facade's coats. There's also a probability that data are not accurate because they often come from home meteo-stations (so that's why collaborative mass data collection must absolutely be driven by expertise). Sincerely, I can't say. Scientific researches go in the opposite direction and indicate the central areas as the most at risk for hot waves and a thing I find very interesting is that, looking at the maps in the first reference I posted, the “moderate risk” zone in Rome is very extended, far far away from the municipality border. For the peripheral urban districts with very high summer temperatures, according to me, it's necessary a “reforestation”, a massive use of vegetation, many more trees, and the destruction, wherever it's possible, of the big asphalt extensions, that are often without any sense, like on parking areas, public open spaces, etc. Secondly, much attention should be put on roofs materials. [1]: https://edxuploads.s3.amazonaws.com/14494297592067021.jpg [2]: https://edxuploads.s3.amazonaws.com/14494299816218369.png [3]: http://4.bp.blogspot.com/-wc73ITB0Bjg/VQAyASvOppI/AAAAAAABR1w/HVLfFjon7KM/s1600/10685529_10205613088076821_499488189636658605_n.jpg [4]: http://imagestc.trovacasa.net/annunci/L/A_9284_21065090_144564624/appartamento-in-vendita-a-roma.jpg