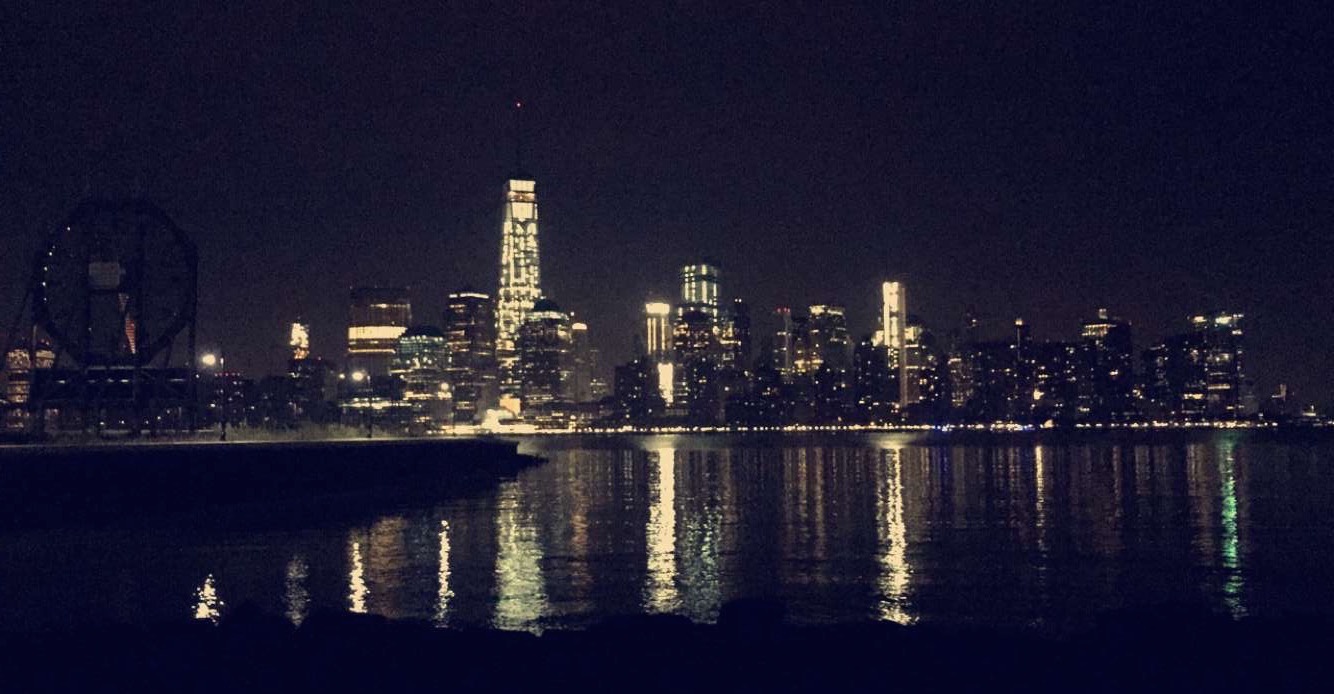
Uploaded on 2015-12-15 by jibranhk
Ugly, but informative resource for manhattan and surrounding area temperature variation [here][1] Due to rivers on both sides of manhattan and central park in the middle, the temperature along the borough is typically cool compared to the center of the financial district and wall st -- where temperatures are 2-4 degrees higher. I took the attached photo from jersey city viewing the hudson river along the financial district of manhattan. cooler winds from over the water help cool the city, but strong winds make walking through some of the awkward street configuration uncomfortable. **What I propose:** begin with powerful initiatives: incorporate a network of connected sensors and devices to accurately measure and collect real-time data such as wind velocity, humidity, smog, temperature (canopy and surface layers). include trees and shrubbery and flowers along the city sides and up building exteriors (with taste). side note: vertical farming will be awesome to see when realized in cities. **Current policy making:** the resource i linked above ([also here][2] for redundancy) is from the Consortium for Climate Change Risk in the Urban Northeast. another resource on urban policy changes is from [CUSP NYC][3]. they've developed an interactive map tool to inform citizens to collect data and support citizen science. ![enter image description here][4] [1]: http://glasslab.engr.ccny.cuny.edu/u/brianvh/UHI/ [2]: http://glasslab.engr.ccny.cuny.edu/u/brianvh/UHI/ [3]: http://www.cuspproject.org/cities/new-york-city#.VnBg5K6rS8o [4]: https://edxuploads.s3.amazonaws.com/14502062095200062.jpg